Gold
On Thursday, gold prices rebounded after dipping to around $2,602 per ounce, driven by weak US labor market data. This marked the end of a six-day decline. By the close of trading, gold was up 0.86%, settling at $2,629.97 per ounce.
Multiple key US economic reports were released on Thursday. Consumer prices for September rose slightly above expectations, but the annual increase was the smallest in three and a half years. Initial jobless claims also surged to a one-year high, driven by hurricane-related disruptions and ongoing strikes at Boeing. The overall CPI and core CPI exceeded expectations but showed a deceleration, prompting markets to increase bets on a 25-basis point rate cut by the Federal Reserve in November.
According to the CME FedWatch tool, the probability of a 25-basis point rate cut has risen to 86.4%, up from 76% before the data release. However, Atlanta Fed President Bostic remained open to pausing rate cuts in November.
Geopolitical tensions also played a role in supporting gold prices. Israel’s plan to strike Iran has raised concerns about a broader conflict in the Middle East, attracting safe-haven buying and dip-buying interest in gold.
Investors should continue monitoring geopolitical developments and key US economic data, including September’s PPI and the University of Michigan’s Consumer Sentiment Index for October.
Gold Technical Analysis:
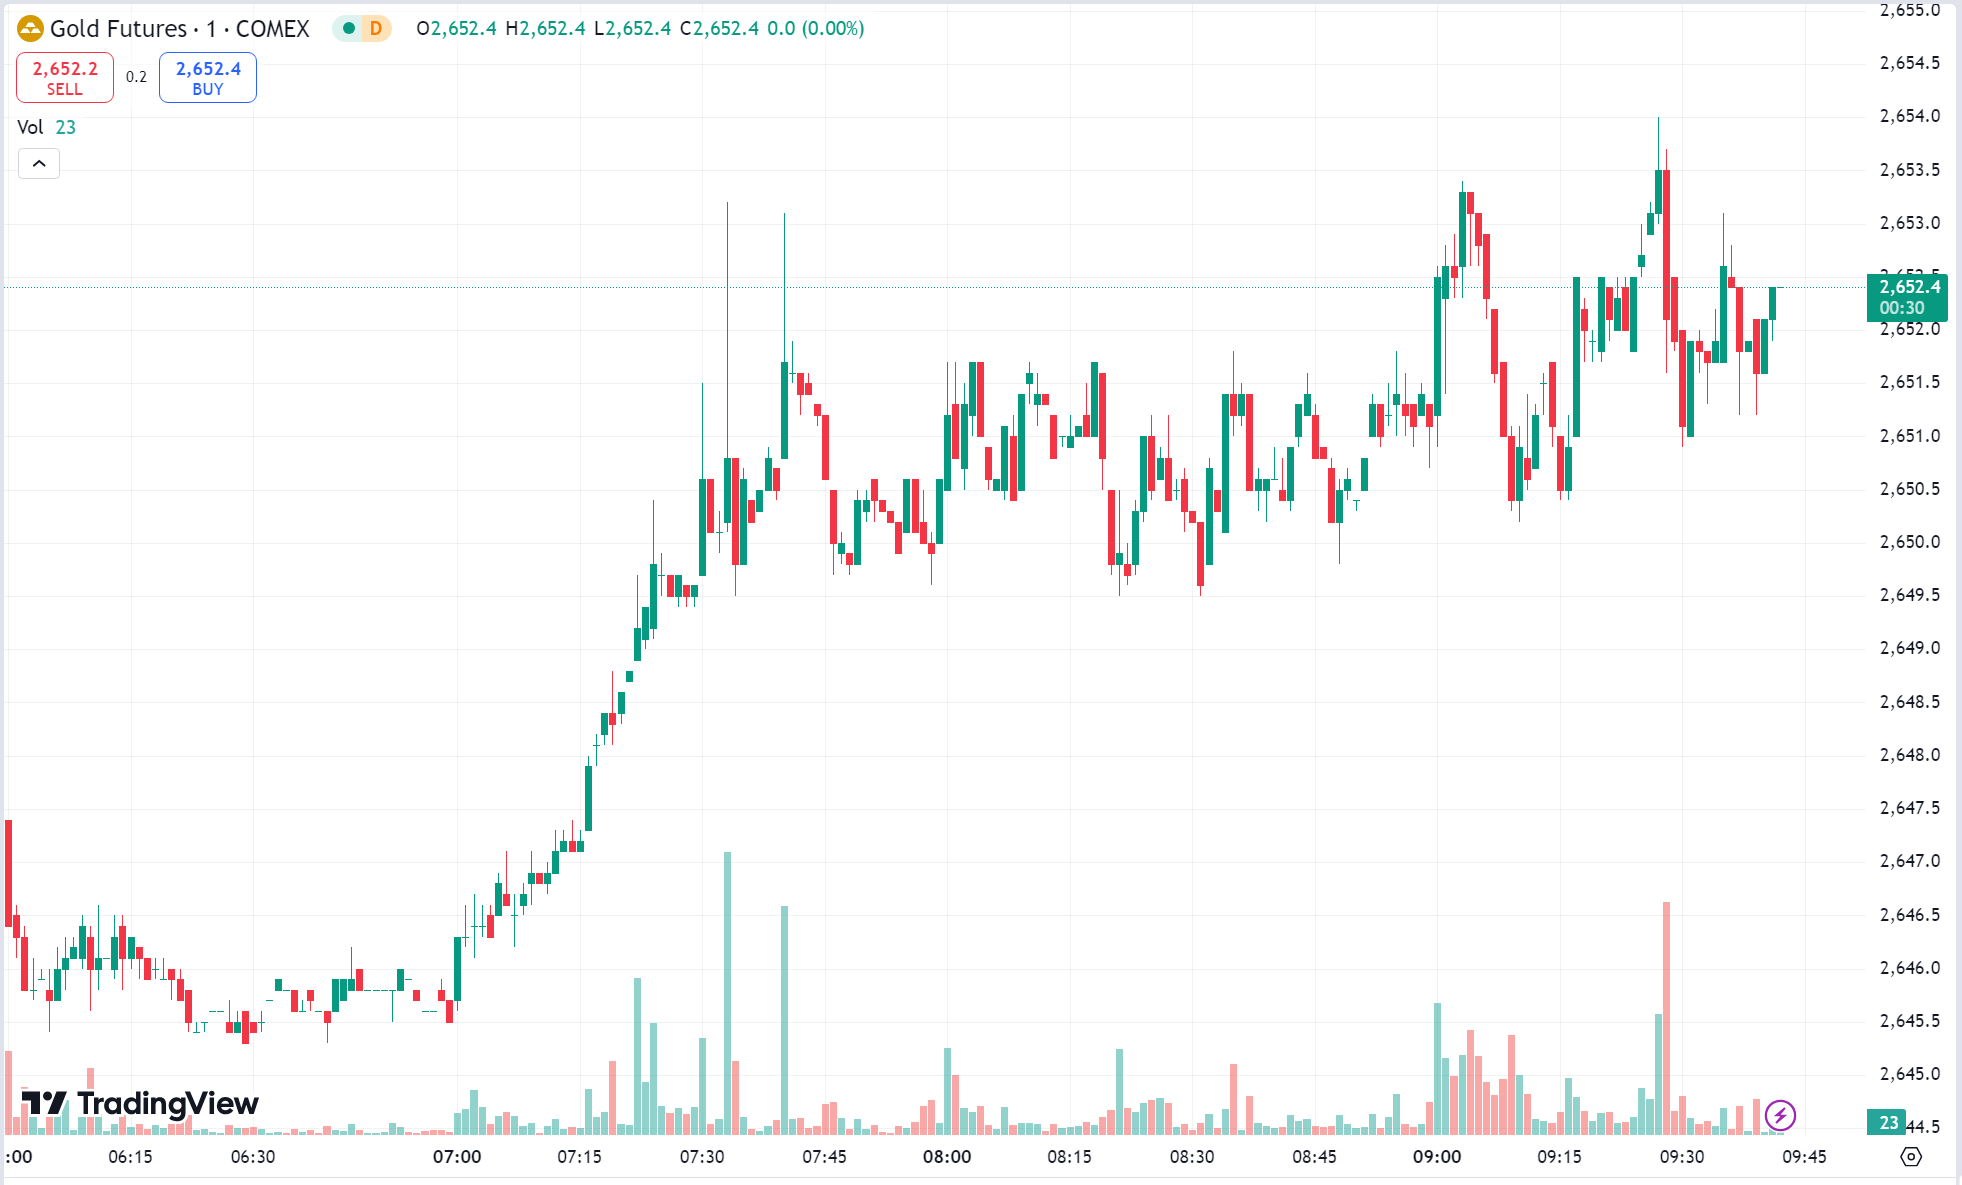
Gold opened near $2,607.5 per ounce, experienced a brief dip to $2,602.1 during the US session, and then saw a strong rebound, closing at $2,630 per ounce. With this long lower shadow candlestick pattern, the market may test resistance levels ahead.

Today’s Focus:
- Trade with a buy-on-pullback strategy, complemented by sell-on-rebound.
- Resistance levels: $2,652-$2,662.
- Support levels: $2,616-$2,611.
Oil
On Thursday, oil prices surged as concerns over an escalation of the Israel-Iran conflict, coupled with the impact of Hurricane Milton on US oil production, drove prices higher. WTI crude oil rose by $2.61, or 3.6%, to settle at $75.85 per barrel, while Brent crude gained $2.82, or 3.7%, to close at $79.40 per barrel.
Middle East tensions continue to escalate. Israeli Defense Minister Gallant promised a “deadly, precise, and unexpected” response to Iran, further stoking fears of a broader regional conflict. Arab officials also reported that Iran threatened to target Gulf states and other US allies if their territories or airspace are used to attack Iran.
Barclays highlighted that rising geopolitical tensions pose a significant binary risk to the oil market, leading to increased volatility. Should supply disruptions reach 1 million barrels per day, oil prices could surge by at least $15 per barrel.
Additionally, Hurricane Milton caused widespread damage in Florida, leading to power outages for millions and gasoline shortages at a quarter of the state’s gas stations. Analysts warn that the storm’s impact on energy supplies could last into the following week.
Investors should continue to monitor Hurricane Milton’s impact, geopolitical developments, and key US economic data such as September’s PPI and crude oil drilling data.
Oil Technical Analysis:
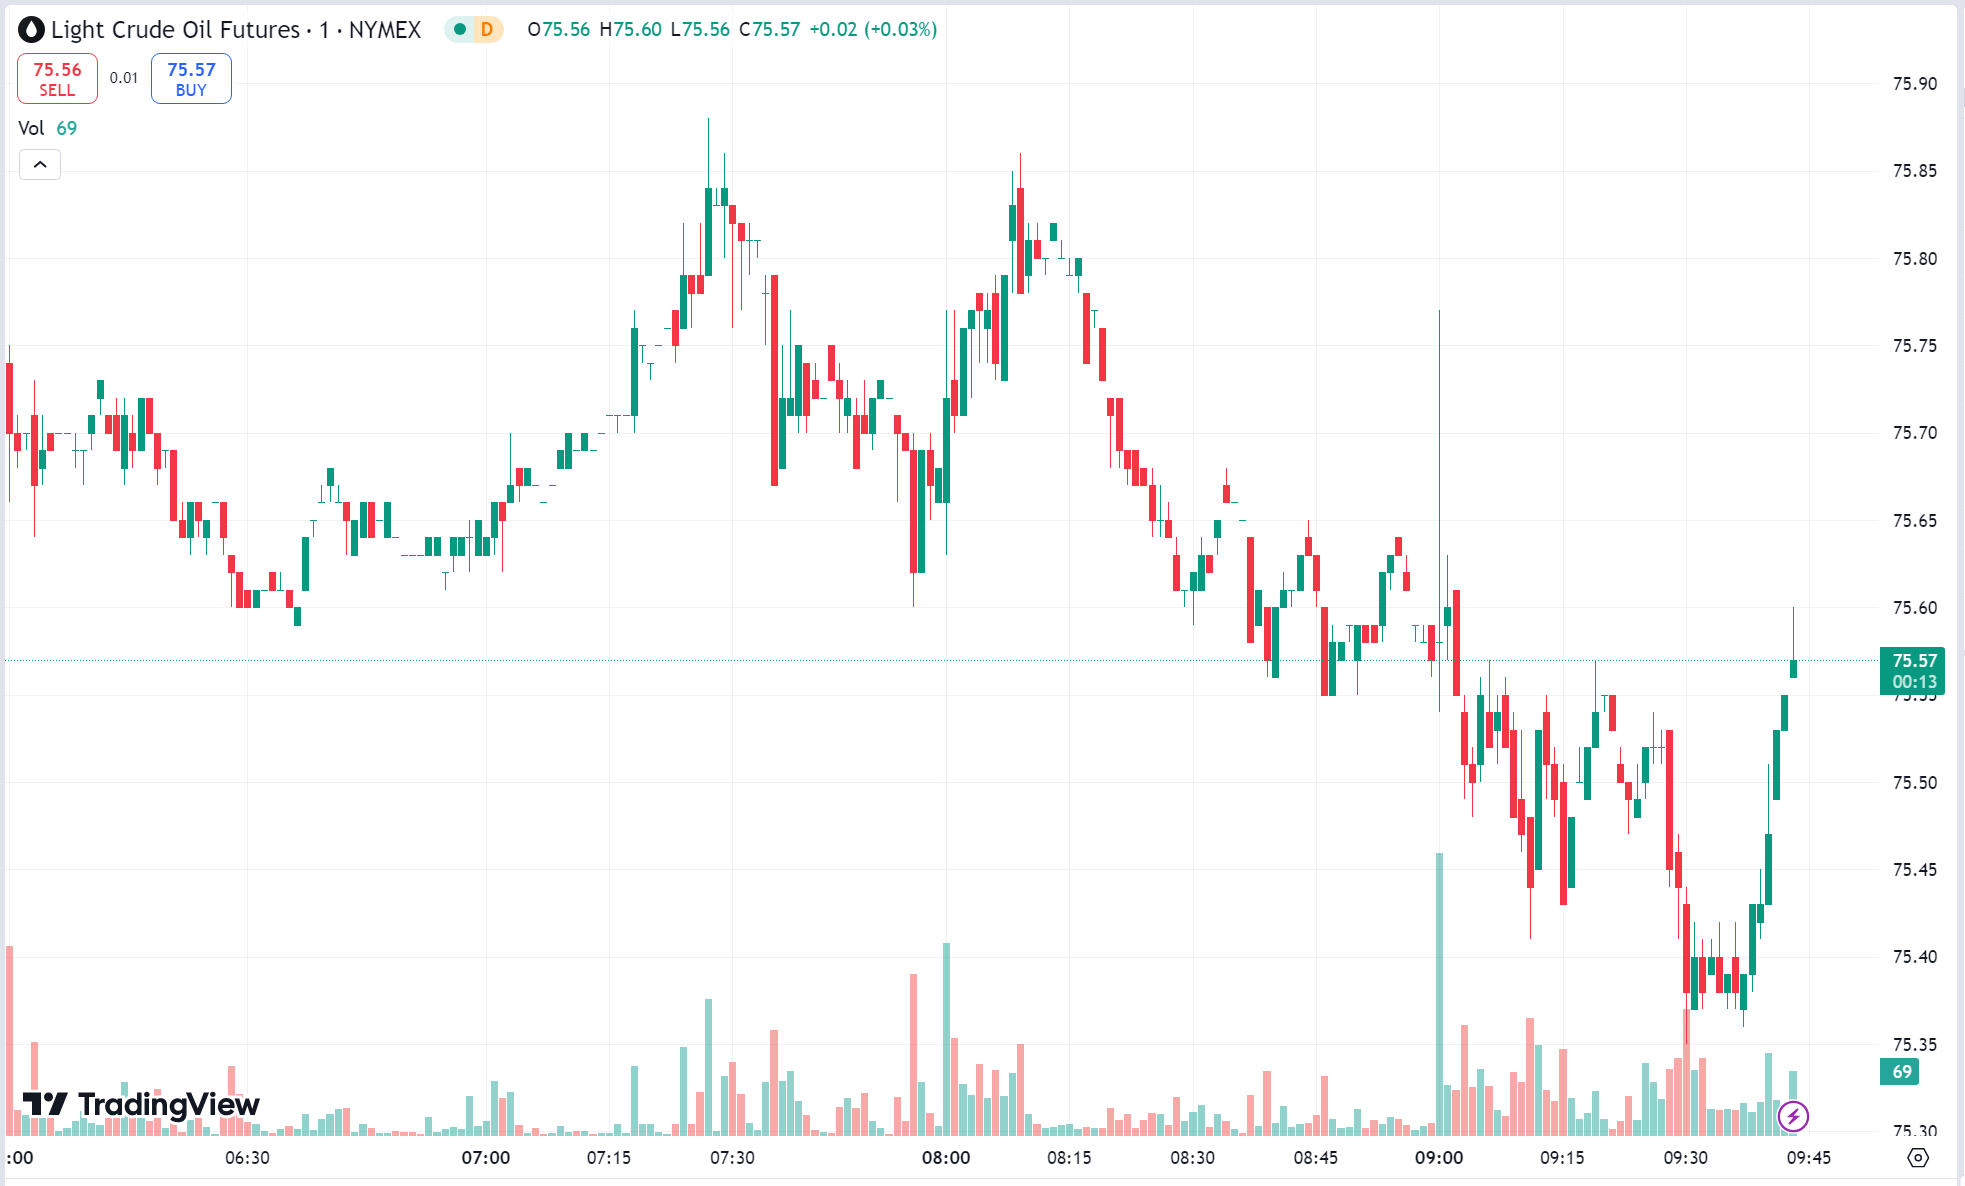
Oil prices continued their rally, opening at $73.54 per barrel and reaching an intraday high of $76.2. The market eventually closed at $75.89 per barrel, forming a strong bullish candlestick pattern, indicating further potential for upside movement.

Today’s Focus:
- Favor buy-on-dip strategies, with sell-on-rebound opportunities.
- Resistance levels: $77.0-$78.4.
- Support levels: $74.5-$73.4.
Risk Disclosure
Securities, Futures, CFDs and other financial products involve high risks due to the fluctuation in the value and prices of the underlying financial instruments. Due to the adverse and unpredictable market movements, large losses exceeding your initial investment could incur within a short period of time.
Please make sure you fully understand the risks of trading with the respective financial instrument before engaging in any transactions with us. You should seek independent professional advice if you do not understand the risks explained herein.
Disclaimer
This information contained in this blog is for general reference only and is not intended as investment advice, a recommendation, an offer, or an invitation to buy or sell any financial instruments. It does not consider any specific recipient’s investment objectives or financial situation. Past performance references are not reliable indicators of future performance. Doo Prime and its affiliates make no representations or warranties about the accuracy or completeness of this information and accept no liability for any losses or damages resulting from its use or from any investments made based on it.
The above strategies reflect only the analysts’ opinions and are for reference only. They should not be used or considered as the basis for any trading decisions or as an invitation to engage in any transaction. Doo Prime does not guarantee the accuracy or completeness of this report and assumes no responsibility for any losses resulting from the use of this report. Do not rely on this report to replace your independent judgment. The market is risky, and investments should be made with caution.

