
Gold
On Wednesday, driven by a smaller-than-expected drop in US August new home sales, both the dollar and US bond yields surged, prompting caution among gold bulls. After briefly hitting a historic high near $2,670, gold prices turned lower, ultimately closing nearly flat at $2,657.16 per ounce.
US data showed that August new home sales fell less than anticipated, and with mortgage rates and home prices declining, sales are expected to regain momentum in the coming months.
Additionally, Federal Reserve Governor Adriana Kugler stated on Wednesday that inflation is unlikely to fall below the Fed’s 2% target. She noted that while some inflation measures excluding housing are below target, the Fed’s focus is on overall inflation, which is nearing but still above 2%.
The dollar index rebounded sharply after hitting a 14-month low on Tuesday, recovering all its previous day’s losses and closing at 100.92, up around 0.257%. US Treasury yields also climbed across the board on Wednesday, putting pressure on gold, which lacked the momentum to sustain its rally.
Looking ahead, investors can monitor key US data, including initial jobless claims for the week ending September 21 and the final estimate for Q2 GDP. Also, watch for speeches from several Federal Reserve officials, including Williams.
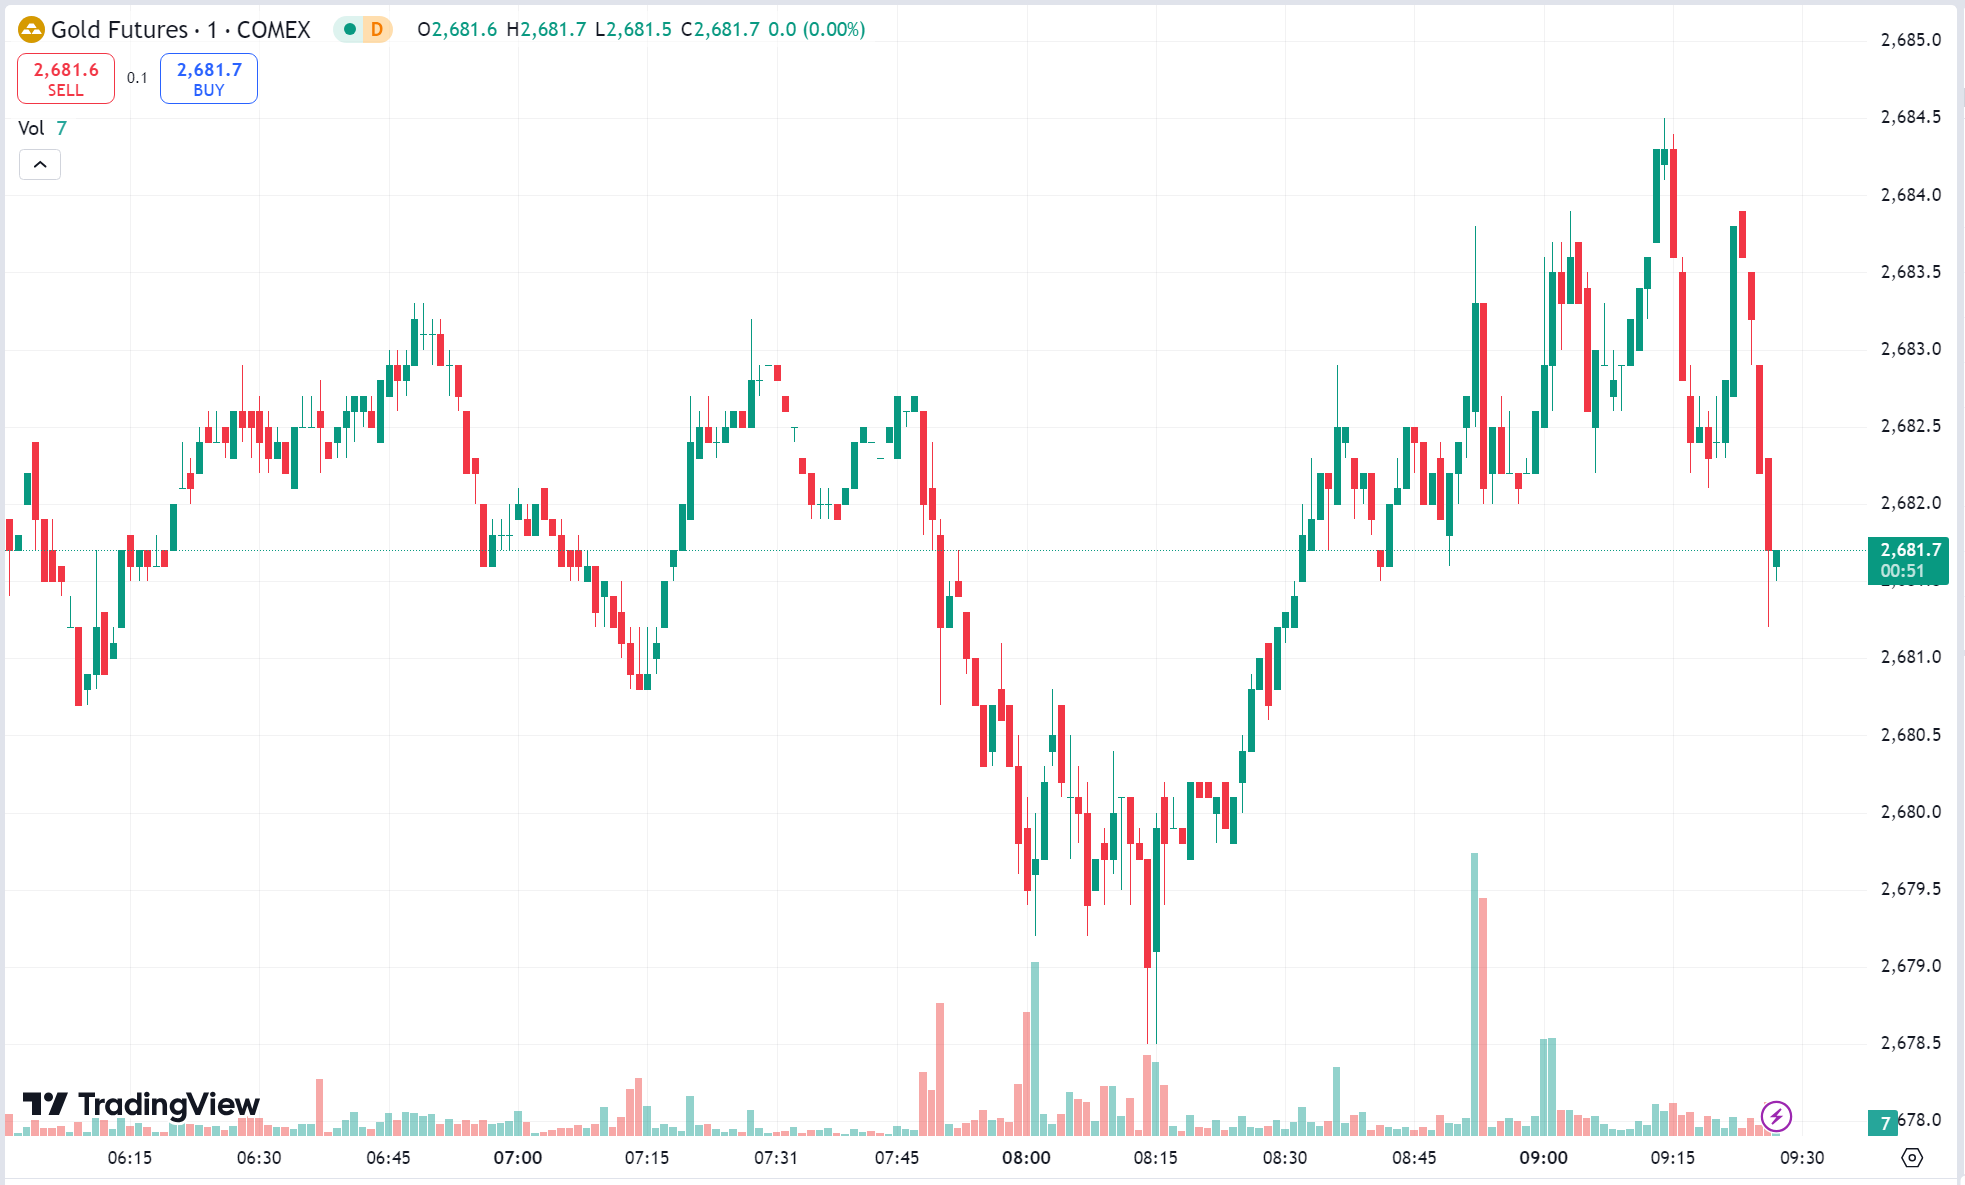
Gold Technical Analysis:
Gold extended its bullish trend on Wednesday, rising above $2,670 during the Asian session before pulling back into consolidation. In the US session, prices retreated to around $2,649 before rebounding, with the daily chart showing a doji candlestick formation. The overall trend remains bullish with ongoing consolidation.
Today’s Focus:
Consider buying on dips and selling on rebounds.
- Resistance: $2,670-$2,675
- Support: $2,645-$2,640
Oil
Oil prices tumbled on Wednesday due to the potential resolution of Libyan oil supply disruptions and efforts to broker a temporary ceasefire between Israel and Hezbollah. By the close, WTI crude fell $1.87, or 2.61%, to settle at $69.69 per barrel, while Brent crude dropped $1.71, or 2.27%, to $73.46 per barrel.
Reports indicated that Libyan factions had signed an agreement outlining procedures and a timeline for appointing the country’s central bank governor, deputy governor, and committee members. This deal may help resolve the crisis over control of the central bank and oil revenues, which has significantly reduced Libya’s oil production and exports.
Meanwhile, tensions between Iran-backed Hezbollah and Israel have escalated, but with US and French intervention, market concerns have eased. France’s foreign minister stated that they are working with the US to promote a 21-day temporary ceasefire between Israel and Hezbollah to facilitate negotiations, with an announcement expected soon.
However, oil prices received some support from US Energy Information Administration (EIA) data showing a larger-than-expected drawdown in US crude inventories. Stockpiles fell by 4.5 million barrels in the week ending September 20, providing some price support and limiting the overall decline.
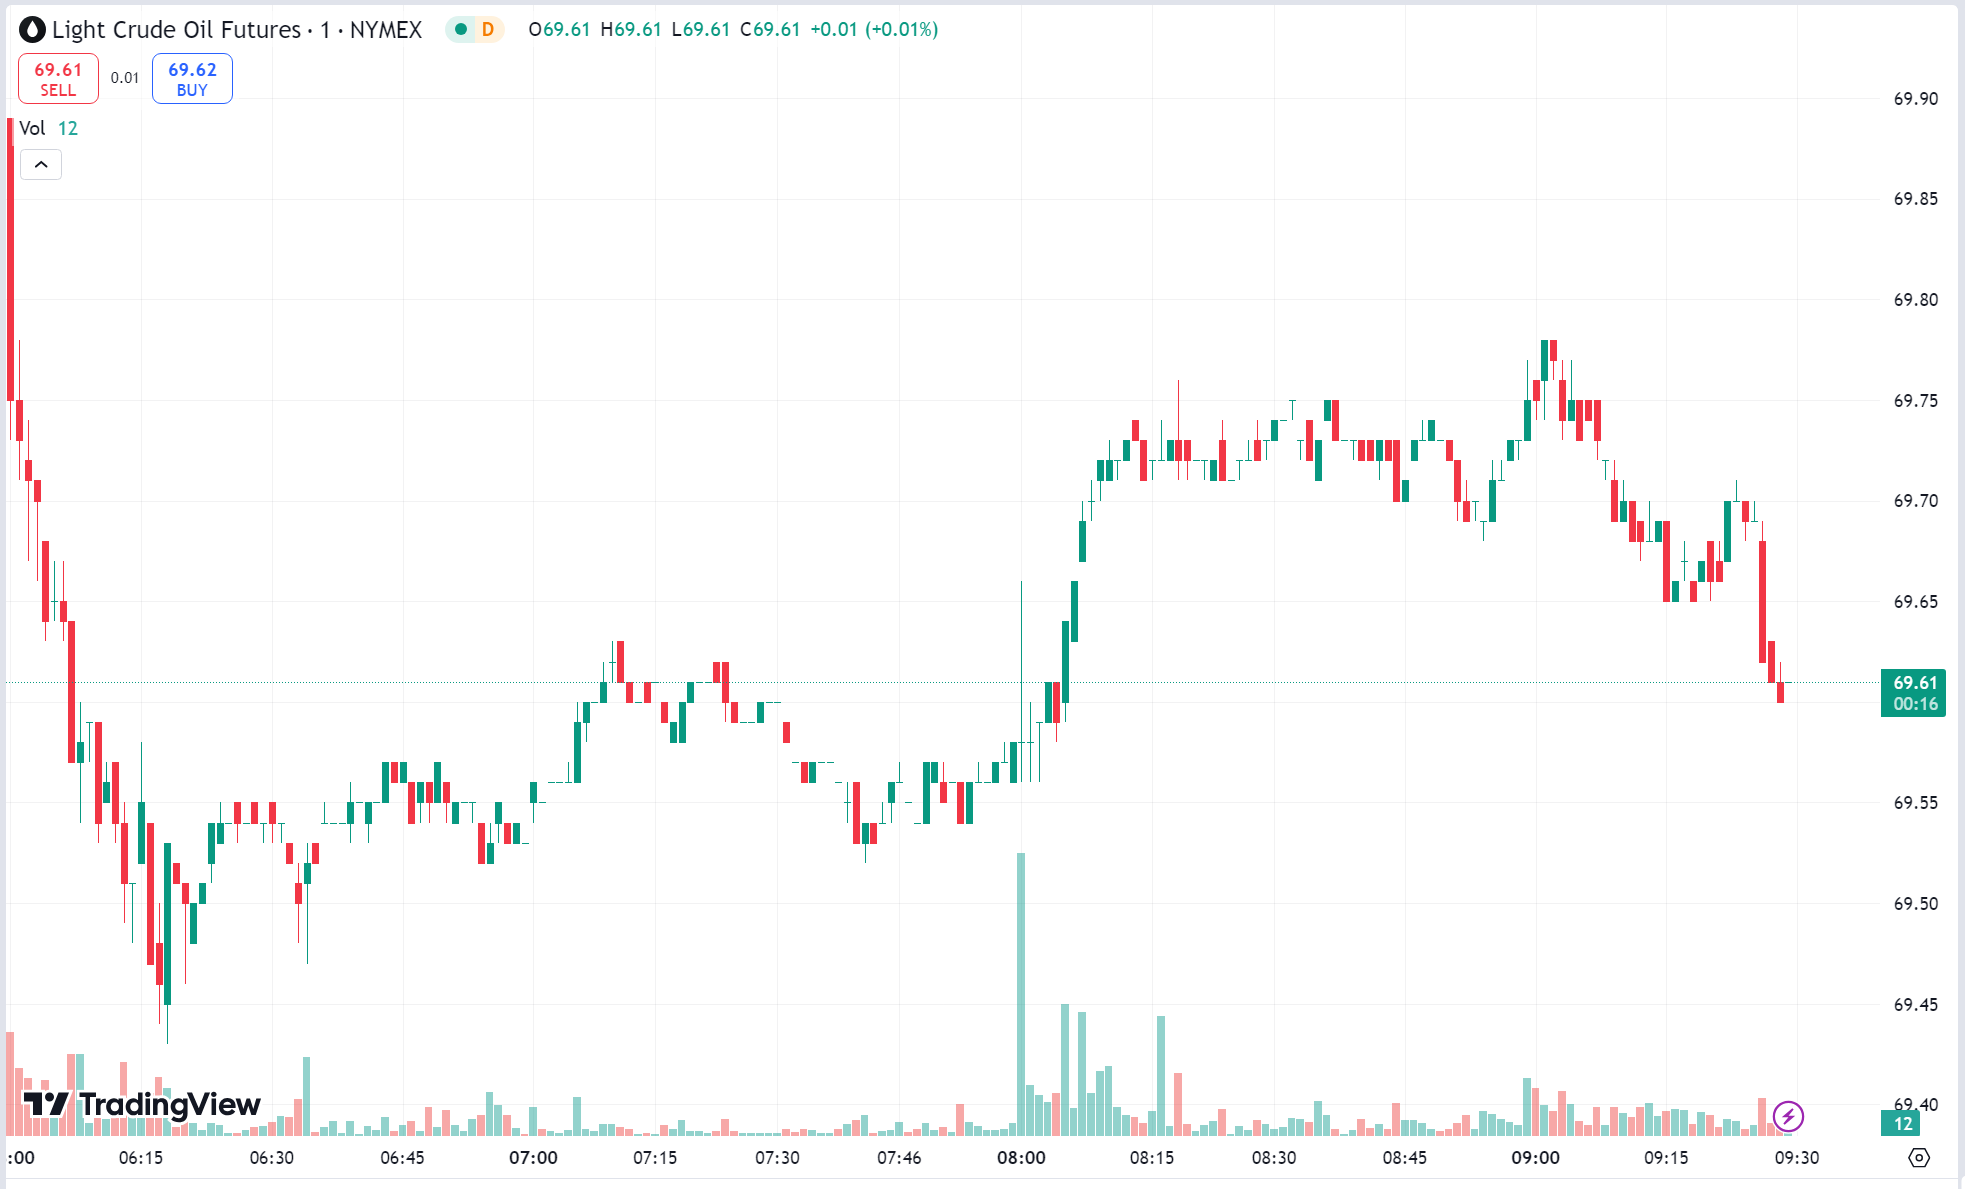
Oil Technical Analysis:
Oil prices faced resistance at the $71.6 level in the Asian session, leading to a pullback that continued throughout the day. The daily chart shows a bearish candle as prices remain under pressure, continuing their downward trend. On the 4-hour chart, oil is currently in a second wave of a recovery, nearing key resistance from the downward trendline.
Today’s Focus:
Focus on selling during rebounds, with buying on dips as a secondary option.
- Resistance: $71.0-$71.5
- Support: $68.5-$68.0
Risk Disclosure
Securities, Futures, CFDs and other financial products involve high risks due to the fluctuation in the value and prices of the underlying financial instruments. Due to the adverse and unpredictable market movements, large losses exceeding your initial investment could incur within a short period of time.
Please make sure you fully understand the risks of trading with the respective financial instrument before engaging in any transactions with us. You should seek independent professional advice if you do not understand the risks explained herein.
Disclaimer
This information contained in this blog is for general reference only and is not intended as investment advice, a recommendation, an offer, or an invitation to buy or sell any financial instruments. It does not consider any specific recipient’s investment objectives or financial situation. Past performance references are not reliable indicators of future performance. Doo Prime and its affiliates make no representations or warranties about the accuracy or completeness of this information and accept no liability for any losses or damages resulting from its use or from any investments made based on it.
The above strategies reflect only the analysts’ opinions and are for reference only. They should not be used or considered as the basis for any trading decisions or as an invitation to engage in any transaction. Doo Prime does not guarantee the accuracy or completeness of this report and assumes no responsibility for any losses resulting from the use of this report. Do not rely on this report to replace your independent judgment. The market is risky, and investments should be made with caution.

