US Stocks
Fundamental Analysis:
U.S. stocks ended slightly lower yesterday, with the S&P 500 and the Dow down by about 0.1%. However, all three major stock indices performed strong in August, a time traditionally regarded as a period of calm in the stock market. After all hitting record highs in the second half of August, the three major stock indices were under pressure from technology stocks on the last day of August.
Before Tuesday, the S&P 500 index set a record closing high for four of the five trading days. The S&P 500 rose by 2.9% in August, the seventh consecutive month of growth, while the Dow Jones Industrial Average and the Nasdaq rose by 1.2% and 4%, respectively.
The performance reflects the level of investors’ confidence in US equities derived from the Federal Reserve’s continued dovish tone toward tapering its massive stimulus program.
While a strong recovery in economic growth and corporate earnings has boosted US stocks, investors are concerned about rising coronavirus cases and the path of Fed policy.
US consumer confidence fell to a six-month low in August, according to survey data from the Conference Board on Tuesday, 31 August 2021, offering a cautious note for the economic outlook.
Technical Analysis:

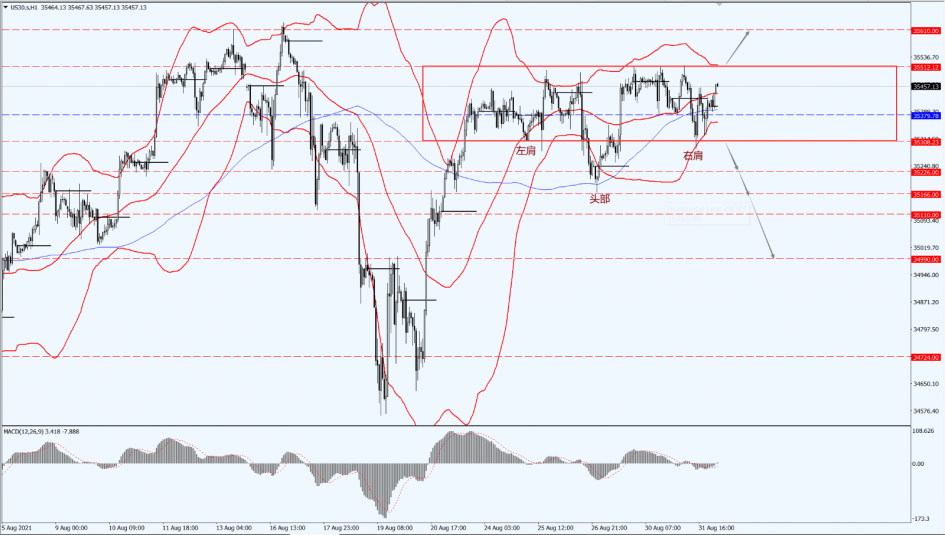
(Dow30,1-hour chart)
Execution Insight:
The Dow has formed a top head and shoulders pattern at its high yesterday, and the basic operating range is still maintained at 35308–35512. Therefore, pay attention to the direction of the Dow’s breakthrough in the range of 35308–35512. If it breaks through the 35512 line, it means that it advances through the neck line of the head and shoulders pattern, which will open up further upward trend for the Dow.
On the top, focus on the suppression strength of the 35610 line. If it drops below the 35308 line, it might lead to a further stock pullback for the Dow. At that time, pay attention to the support of the 35226 and 35166 positions. Once it falls below the 35166 range, the head and shoulders pattern is destroyed and that the Dow will show deep pullbacks.
Hong Kong Stocks
Fundamental Analysis:
The Hang Seng Index down by 7.17 points, or 0.03%, sitting at 25,871. 82; Hang Seng China Enterprises Index dipped by 3.98 points, or 0.04%, maintaining at 9,179.78; red chip stock dropped by 6.58 points, or 0.17%, settling at 3,907.48; and the Hang Seng Technology Index rose by 0.39 points.
On the intraday market, mobile phone concept stocks, photovoltaic stocks, gambling stocks, blue-chip real estate stocks, sporting goods stocks, property management stocks, and gas stocks all rose. Sunny Optical Technology opened 3.57% higher; large-scale technology stocks rose and fell mixed, Tencent and Jingdong opened slightly higher, Kuaishou Tech and Alibaba Group fell by more than 1%; internal housing stocks fell, Greentown China opened more than 4% lower, home appliance stocks, insurance stocks, and automotive stocks weakened. On the other hand, China Pacific Insurance and Geely fell by 1.6% and 1%, respectively.
Technical Analysis:

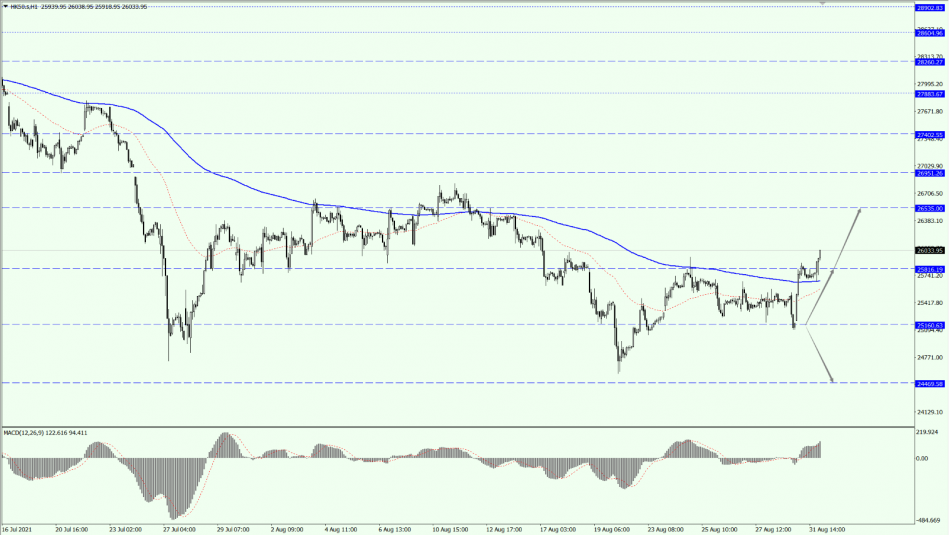
(HK50,1-hour chart)
Execution Insight:
HK50 received a strong support from the buying of the 25160 line yesterday, and reversed the trend into an upward movement. Today, we pay attention to its continued upward strength. Above, focus on the suppression strength of the 26535 line, and keep an eye on the 25816 and 25160 positions below. Once HK50 falls below the 25160 line, it will open up further downward revision.
FTSE China A50 Index
Technical Analysis:

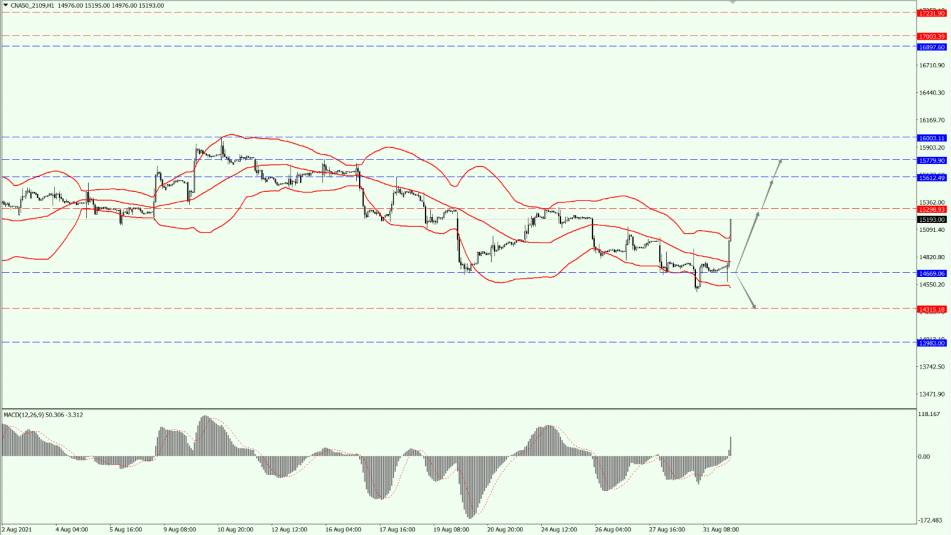
(A50,1-hour chart)
Execution Insight:
A50 formed a bear trap yesterday, and stood above the middle Bollinger Band again, starting a strong upward trend before the market changed. Today, the top focuses on the suppression strength of the two positions 15298 and 15612, and the support of the 14669 line below. As long as A50 does not fall below the 14669 line, it maintains a bullish trend.
Disclaimer
While every effort has been made to ensure the accuracy of the information in this document, DOO Prime does not warrant or guarantee the accuracy, completeness or reliability of this information. DOO Prime does not accept responsibility for any losses or damages arising directly or indirectly, from the use of this document. The material contained in this document is provided solely for general information and educational purposes and is not and should not be construed as, an offer to buy or sell, or as a solicitation of an offer to buy or sell, securities, futures, options, bonds or any other relevant financial instruments or investments. Nothing in this document should be taken as making any recommendations or providing any investment or other advice with respect to the purchase, sale or other disposition of financial instruments, any related products or any other products, securities or investments. Trading involves risk and you are advised to exercise caution in relation to the report. Before making any investment decision, prospective investors should seek advice from their own financial advisers, take into account their individual financial needs and circumstances and carefully consider the risks associated with such investment decision.


