



Gold
With voting underway for the 60th U.S. presidential election, gold rose on safe-haven demand, closing up 0.27% at $2,743.99 per ounce. Investors are closely watching the results, with RealClearPolitics showing Trump leading in five swing states and trailing slightly in two others as of November 5.
Ahead of results, major financial institutions shared their forecasts. Barchart’s senior analyst Darin Newsom expects both candidates to drive dollar depreciation, with Trump’s policies favoring gold as a safer asset. Citi believes that while gold may face short-term pressure post-election, the structural bull market for gold remains solid, predicting prices to reach $3,000 per ounce within six months.
In economic data, October’s U.S. ISM Non-Manufacturing PMI rose to 56.0, the highest since July 2022, indicating solid economic momentum into Q4.
On the geopolitical front, Israeli Prime Minister Netanyahu dismissed Defense Minister Gallant over a “trust crisis,” appointing former foreign minister Katz to oversee conflicts in Gaza and Lebanon.
Today, investors will focus on post-election movements, the U.S. Federal Reserve’s rate decision, and Eurozone economic data.
Gold Technical Analysis:
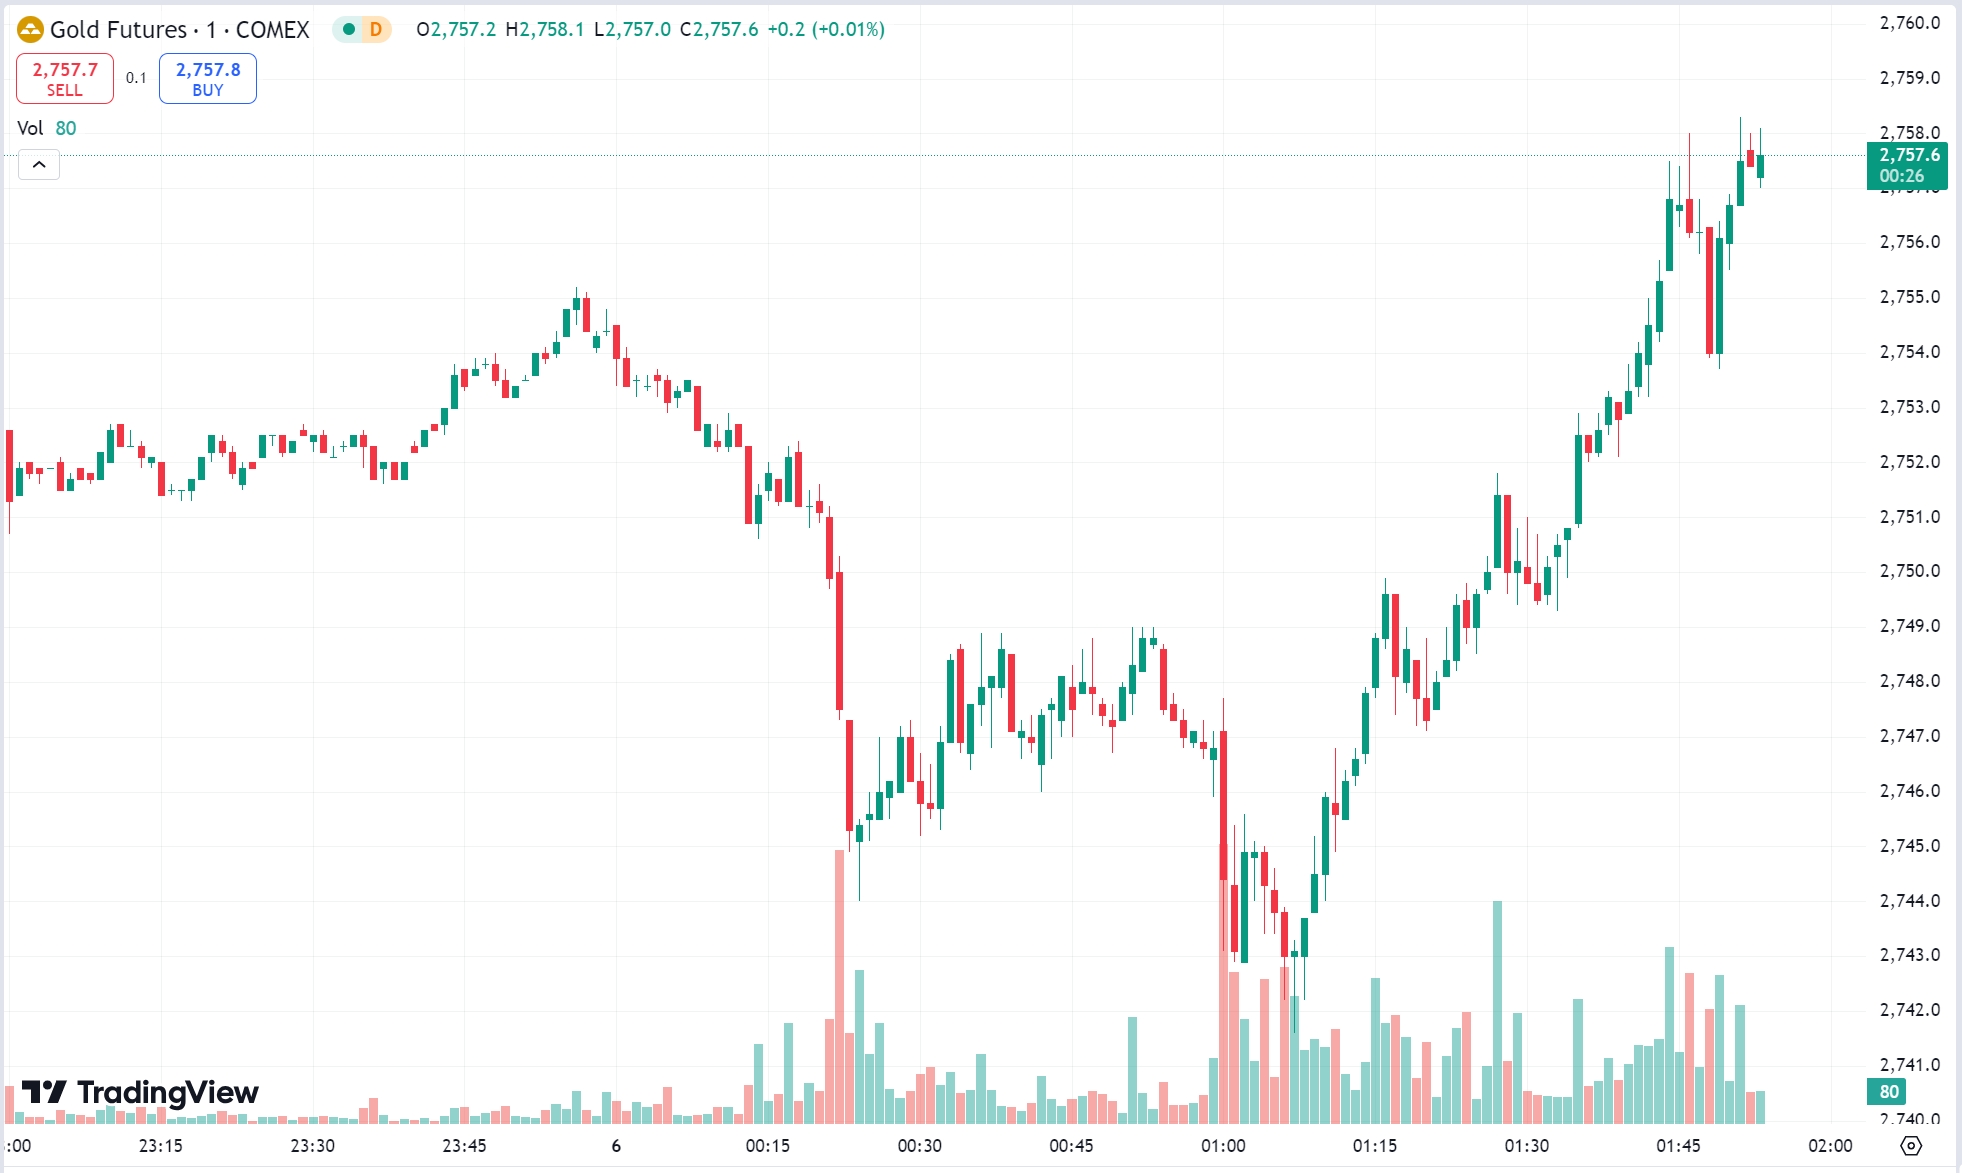
Gold showed a bearish trend after three days of losses, with prices below the short-term moving averages and MACD suggesting a downward trend, indicating a potential bearish bias.
Today’s Focus:
- Resistance: $2,755-$2,760
- Support: $2,730-$2,725
Oil
On Tuesday, oil prices rose as the dollar weakened, hitting a two-week low and stimulating fuel demand. WTI December crude closed up $0.52 (0.73%) at $71.99 per barrel, while Brent January crude rose $0.45 (0.60%) to $75.53 per barrel.
Ahead of election results, the dollar index dropped below 104, closing down 0.467% at 103.41. However, API data weighed on oil, with U.S. crude inventories increasing by 3.132 million barrels, above the expected 1.8 million.
Markets are monitoring tropical storm Rafael, which is moving toward Gulf of Mexico oil platforms, potentially causing disruptions of up to 1.7 million barrels per day. Analysts expect Rafael, forecasted to strengthen into a hurricane, could reduce U.S. oil output by approximately 4 million barrels.
Today, investors will focus on U.S. EIA crude inventory data, geopolitical developments, and election results. Following major cabinet changes in Israel, protests erupted in Tel Aviv.
Oil Technical Analysis:
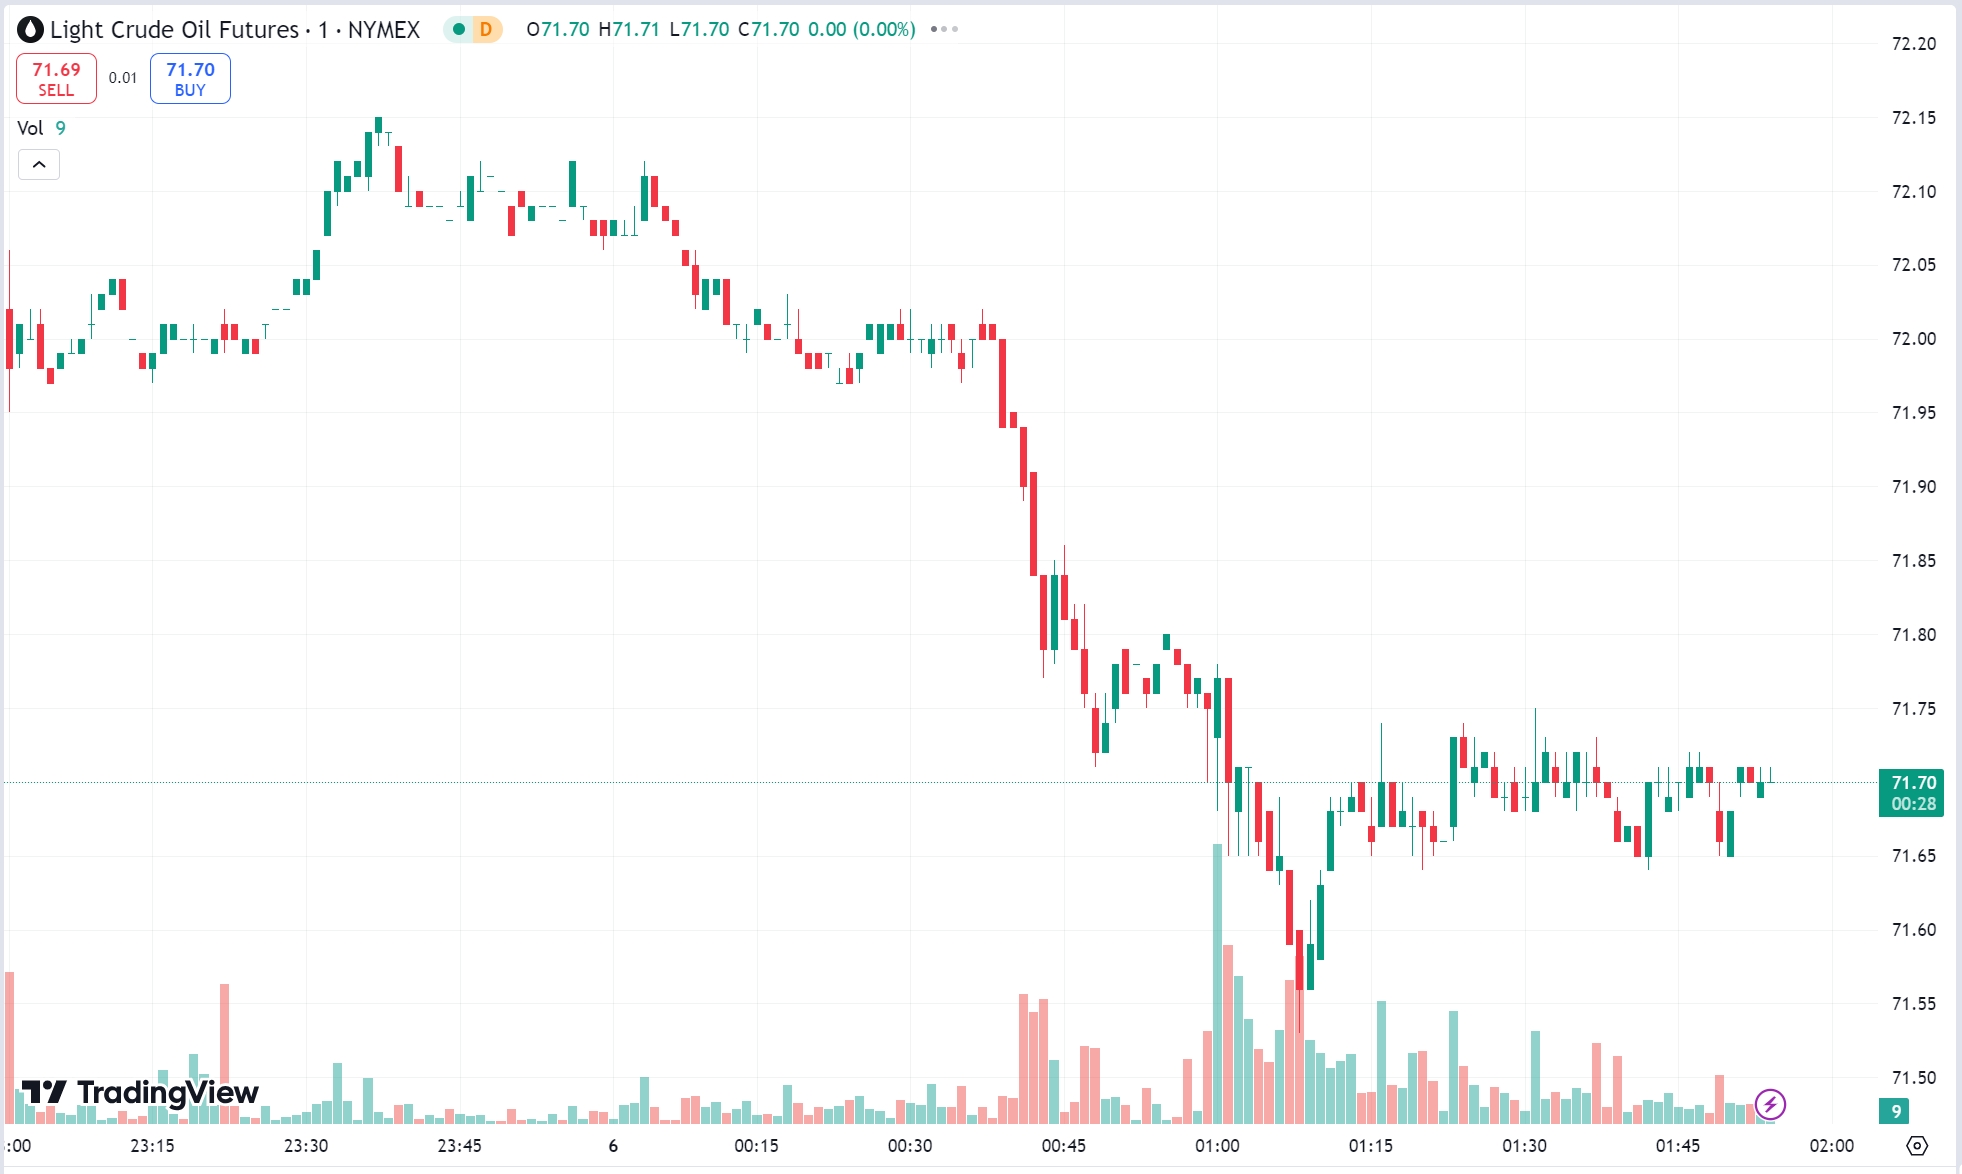
Oil stabilized above $70 and continued upward, peaking at $72.6 before a pullback. Daily chart resistance lies near $72.7, with short-term upward potential but limited by resistance levels.
Today’s Focus:
- Resistance: $73.5-$74.0
- Support: $71.3-$70.8