
Market Recap
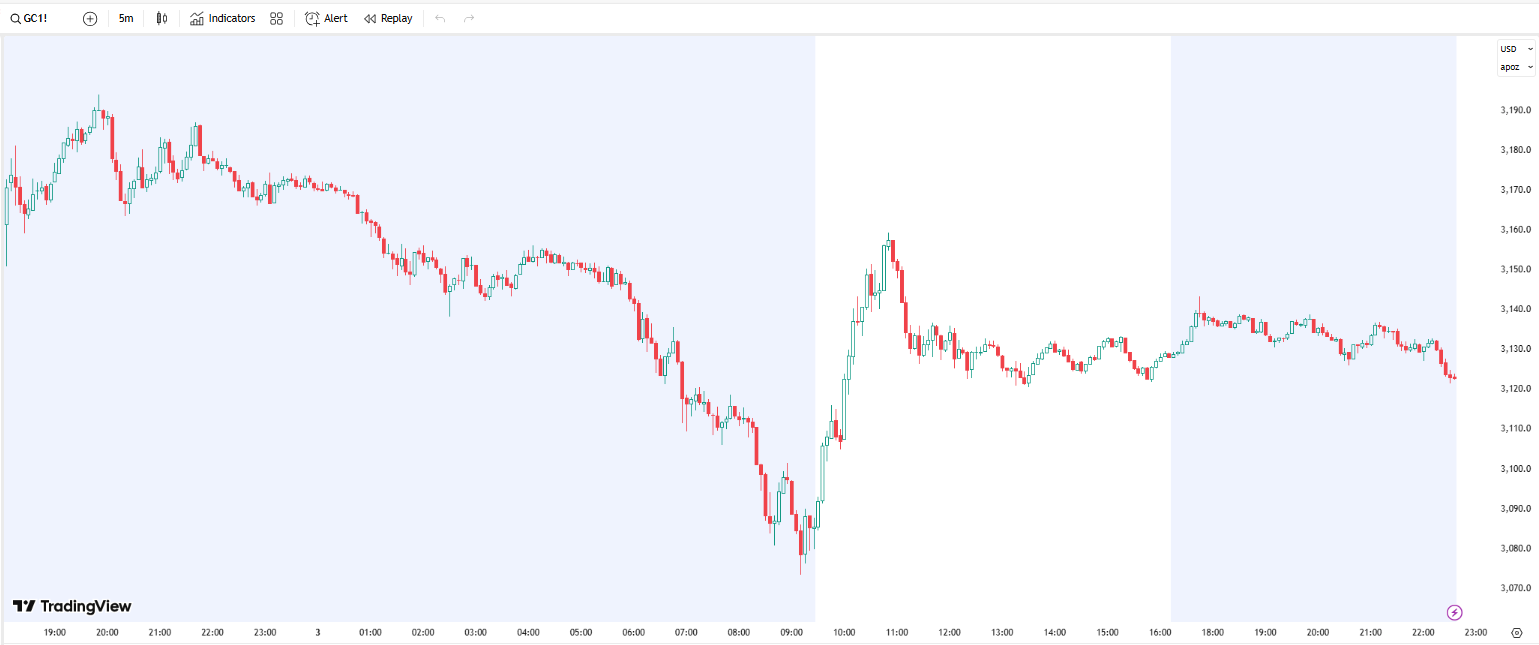
Gold experienced significant fluctuations due to the dual impact of tariff policies and weak economic data. In the early session, President Trump’s tariff policy boosted safe-haven buying, pushing gold to a new record high of $3,167.60 per ounce. However, profit-taking by long positions led to a sharp decline. Later in the evening session, gold found support and rebounded, narrowing its losses.
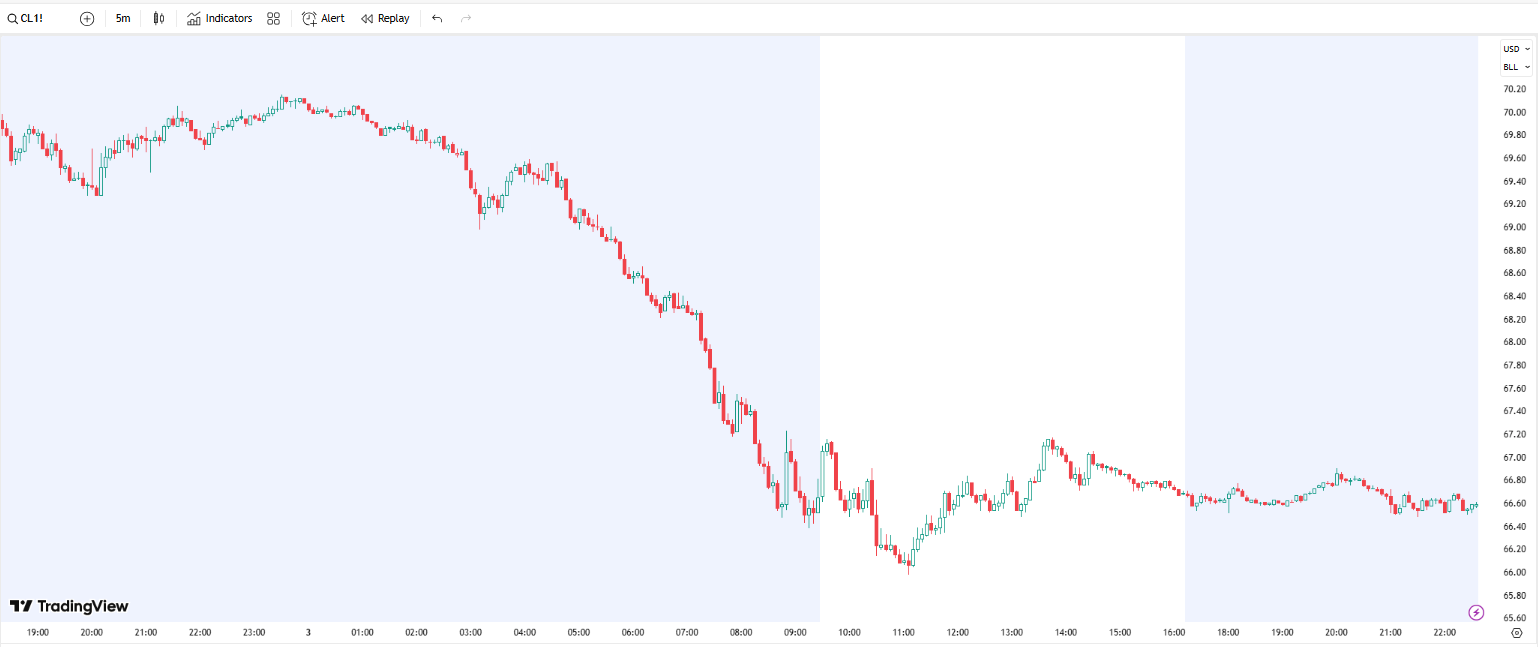
After the US announced its tariff policy, OPEC+ unexpectedly agreed to increase oil production, causing oil prices, already on a downtrend, to plunge sharply, marking the largest drop since 2022.
Gold Market Overview
Gold prices fluctuated widely on Thursday. In the early session, the announcement of Trump’s tariff policy fueled safe-haven demand, pushing gold to an all-time high of $3,167.60 per ounce. However, long positions seized the opportunity to take profits, and gold prices dropped over $100 to $3,054.06 per ounce.
Subsequently, gold found support from bargain hunters, and combined with weak US ISM Non-Manufacturing PMI data for March, and a sharp decline in US stocks, gold was able to recover, reducing its loss after dropping over 2% from the record high.
Gold rebounded above the $3,100 level, closing at around $3,114.05 per ounce, a decline of approximately 0.57%. In early Asian trading, spot gold moved within a narrow range, trading around $3,115.43 per ounce.
On the news front, Trump’s tariff announcement caused a global market sell-off, with the three major US stock indices experiencing their largest single-day percentage declines in years.
Furthermore, the US March ISM Non-Manufacturing PMI dropped from 53.5 to 50.8, reaching the lowest level in nine months, supporting expectations that economic growth might sharply slow in Q1 due to uncertainties from import tariffs. T
he dual impact of the tariff policy and weak data led to the US Dollar Index dropping by 2.35% to 101.26, the lowest level since October 2, 2024, attracting bargain buying to support gold prices.
Investors are now awaiting the release of the US March Non-Farm Payrolls report, which will be a key focus. Additionally, Federal Reserve Chairman Jerome Powell will give a speech later in the day.
Gold – Technical Analysis
From a technical perspective, gold prices surged sharply in the morning, rising nearly $50, hitting a high around $3,168 before facing resistance and entering a correction. During the evening trading session, prices broke below the key $3,100 level, falling to a key support at $3,054, marking a drop of nearly $114.
However, gold prices rebounded strongly by around $80, and the daily chart showed a doji candlestick, indicating a fierce battle between bulls and bears.
Gold – Key Focus for Today
- Consider mainly short positions on rebounds, with some long positions during corrections.
- Short-term resistance is focused on the 3130-3135 range.
- Short-term support is focused on the 3095-3090 range.
Oil Market Overview
The day after President Trump announced new import tariffs, OPEC+ unexpectedly agreed to increase oil production. Oil prices saw a sharp decline on Thursday.
Brent crude futures closed at $70.14 per barrel, down 6.42%, marking the biggest drop since August 1, 2022. US crude futures closed at $66.95 per barrel, down 6.64%, marking the largest drop since July 11, 2022.
In early Friday Asian trading, international oil prices moved within a narrow range, with US crude trading around $66.71 per barrel.
Before the OPEC+ meeting, oil prices had already fallen by about 4%, as investors feared that Trump’s tariffs would escalate the global trade war, slow economic growth, and reduce fuel demand. Following the meeting, eight OPEC+ countries—Russia, Saudi Arabia, UAE, Kuwait, Iraq, Algeria, Kazakhstan, and Oman—agreed to implement an oil production increase plan.
Oil production will rise by 411,000 barrels per day in May, higher than the previously planned 135,000 barrels per day. This unexpected decision caused oil prices, already in a downward trend, to fall even further.
Oil – Technical Analysis
From a technical perspective, oil prices initially rose but then sharply dropped after the tariff policy was implemented. Prices fell below the moving averages, signaling a shift in short-term trend direction.
Bearish momentum is strong, with large bearish candlesticks forming, and prices breaking below the $70 level. The outlook suggests a weak downward trend for oil prices in the short term.
Oil – Key Focus for Today
- Consider mainly short positions on rallies, with some long positions on pullbacks.
- Short-term resistance is focused on the 67.5-68.5 range.
- Short-term support is focused on the 65.5-64.5 range.
Risk Disclosure
Trading in securities, futures, contracts for difference (CFDs) and other financial products carries high risks due to the rapid and unpredictable fluctuation in the value and prices of these financial instruments. This unpredictability is due to the adverse and unpredictable market movements, geopolitical events, economic data releases and other unforeseen circumstances. You may sustain substantial losses, including losses exceeding your initial investment within a short period of time.
You are strongly advised to fully understand the nature and inherent risks of trading with the respective financial instrument before you begin to trade or engage in any transactions with us. When you engage in transactions with us, you acknowledge that you are aware of and accept these risks. You should conduct your own research and consult with an independent qualified financial advisor or professional before making any financial, trading or investment decisions.
Disclaimer
The information contained in this blog is for general informational purposes only and should not be considered as financial, investment, legal, tax or any other form of professional advice, recommendation, an offer, or an invitation to buy or sell any financial instruments. The content herein, including but not limited to data, analyses and market commentary, is presented based on internal records and/or publicly available information and may be subject to change or revision at any time without notice and does not consider any specific recipient’s investment objectives or financial situation. Past performance is not an indicator of future performance and D Prime and its affiliates give no assurance that any views, projections or forecasts will materialize. D Prime and its affiliated entities make no representations or warranties about the accuracy or completeness of this information and disclaim any and all liability for any direct, indirect, incidental, consequential, or other losses or damages arising out of or in connection with the use of or reliance on any information contained in this blog. You should conduct your own research and consult with an independent qualified financial advisor or professional before making any financial, trading or investment decisions.

