Markets were quiet on Thursday due to the Christmas holiday, with trading volumes sharply reduced. Spot gold briefly surged above the $4,500 level in early Wednesday trading, hitting a fresh record high at $4,525.70 per ounce, before retreating as profit-taking emerged. Oil prices edged slightly lower, while Brent and WTI crude remain on track for their largest annual declines since the 2020 pandemic, driven by expectations that global supply will exceed demand next year.
Gold
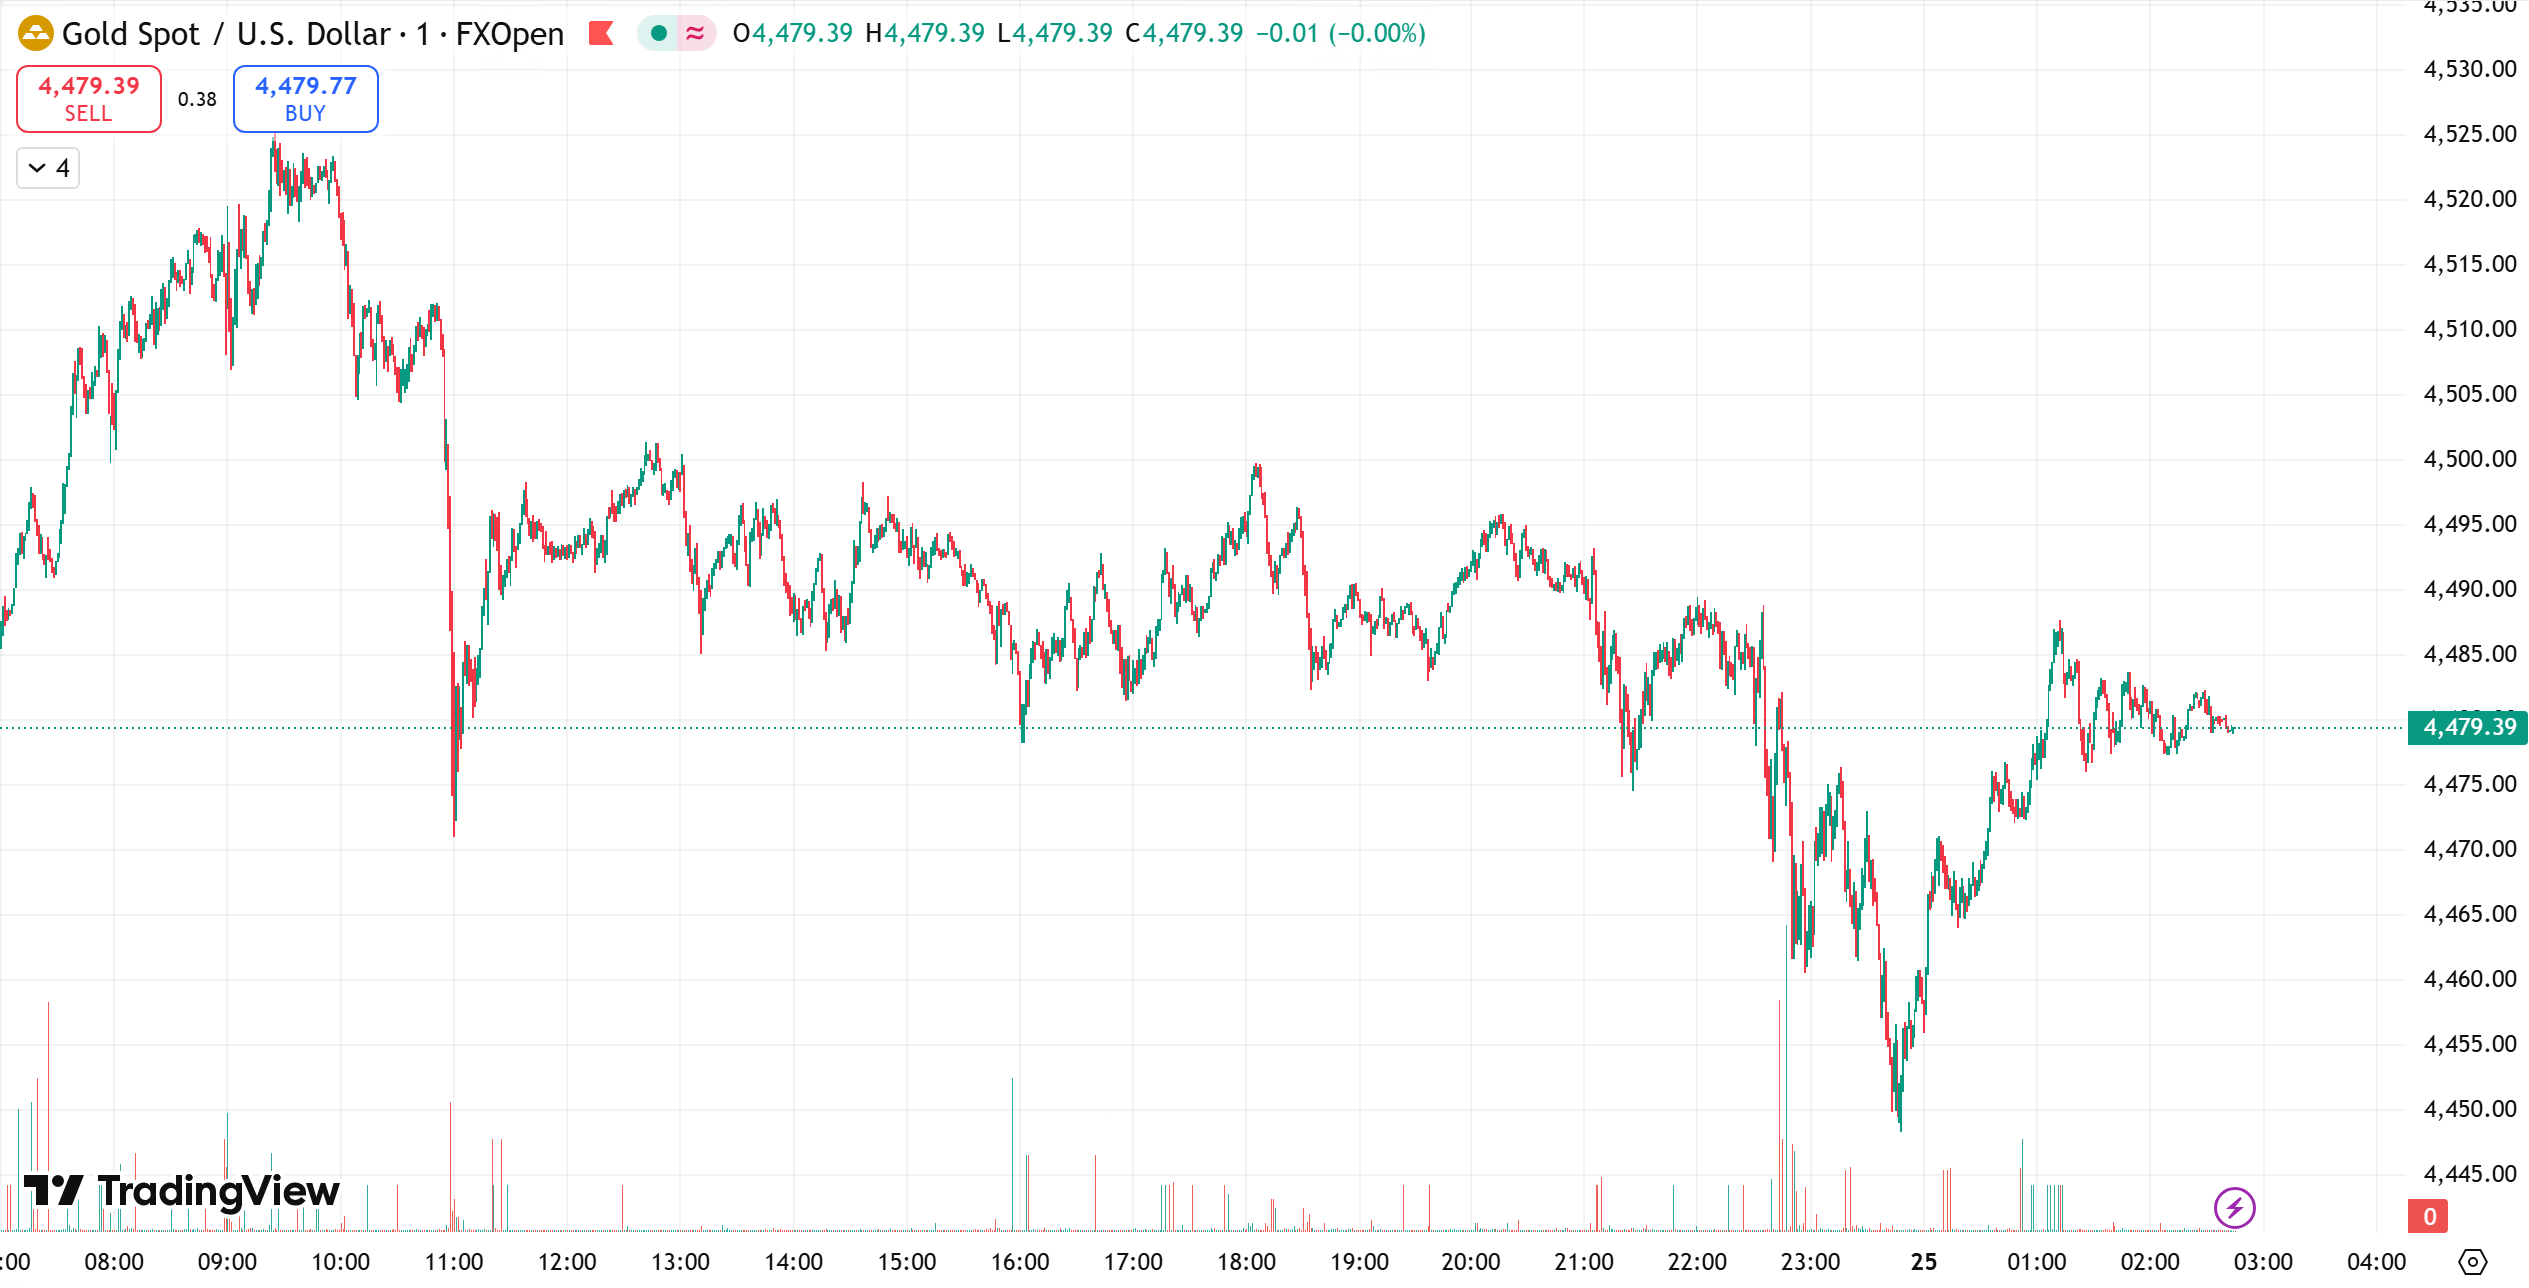
Spot gold broke above the key $4,500 threshold in early Wednesday trading, setting a new all-time high at $4,525.18 per ounce, before giving back part of its gains. US gold futures for February delivery slipped 0.1%, settling at $4,502.80 per ounce.
Silver also extended its historic rally, briefly touching a record high of $72.70 per ounce. Platinum pulled back after reaching a peak of $2,377.50, while palladium dropped sharply, plunging more than 9% to $1,683.58 per ounce.
Precious metals have delivered exceptional gains this year. Silver is up roughly 149% year to date, while gold has risen more than 70%. Platinum and palladium have climbed approximately 145% and over 85%, respectively. The rally has been fueled by tight mine supply, tariff uncertainty, and a rotation of investment flows beyond gold into other precious metals.
Market participants noted that profit-taking after record highs contributed to the pullback. Comments from US President Donald Trump, expressing a preference for the next Federal Reserve chair to cut interest rates, have continued to influence market expectations. Traders currently anticipate two Fed rate cuts next year, while geopolitical risks remain an ongoing source of uncertainty.
From a technical perspective, gold’s price action unfolded largely as expected, first pulling back before resuming its upward move. Prices retreated from the $4,498 area, testing support near $4,452 and $4,431, before rebounding strongly around midnight to reclaim the $4,500 psychological level and post fresh highs.
The broader bullish structure remains intact. While the precise upside ceiling is difficult to define, the overall trend continues to favor buyers. Key support levels to watch include $4,500, followed by $4,470, and the $4,445–$4,450 support zone. As long as prices hold above these levels, the uptrend remains valid. With the Christmas holiday approaching, trading activity may stay subdued, but deep pullbacks appear unlikely under the current strong momentum. Gold is expected to consolidate above support before potentially extending gains.
Focus today:
- Strategy: Buy on dips, sell cautiously on rebounds
- Resistance: $4,510–$4,530
- Support: $4,450–$4,440
Oil
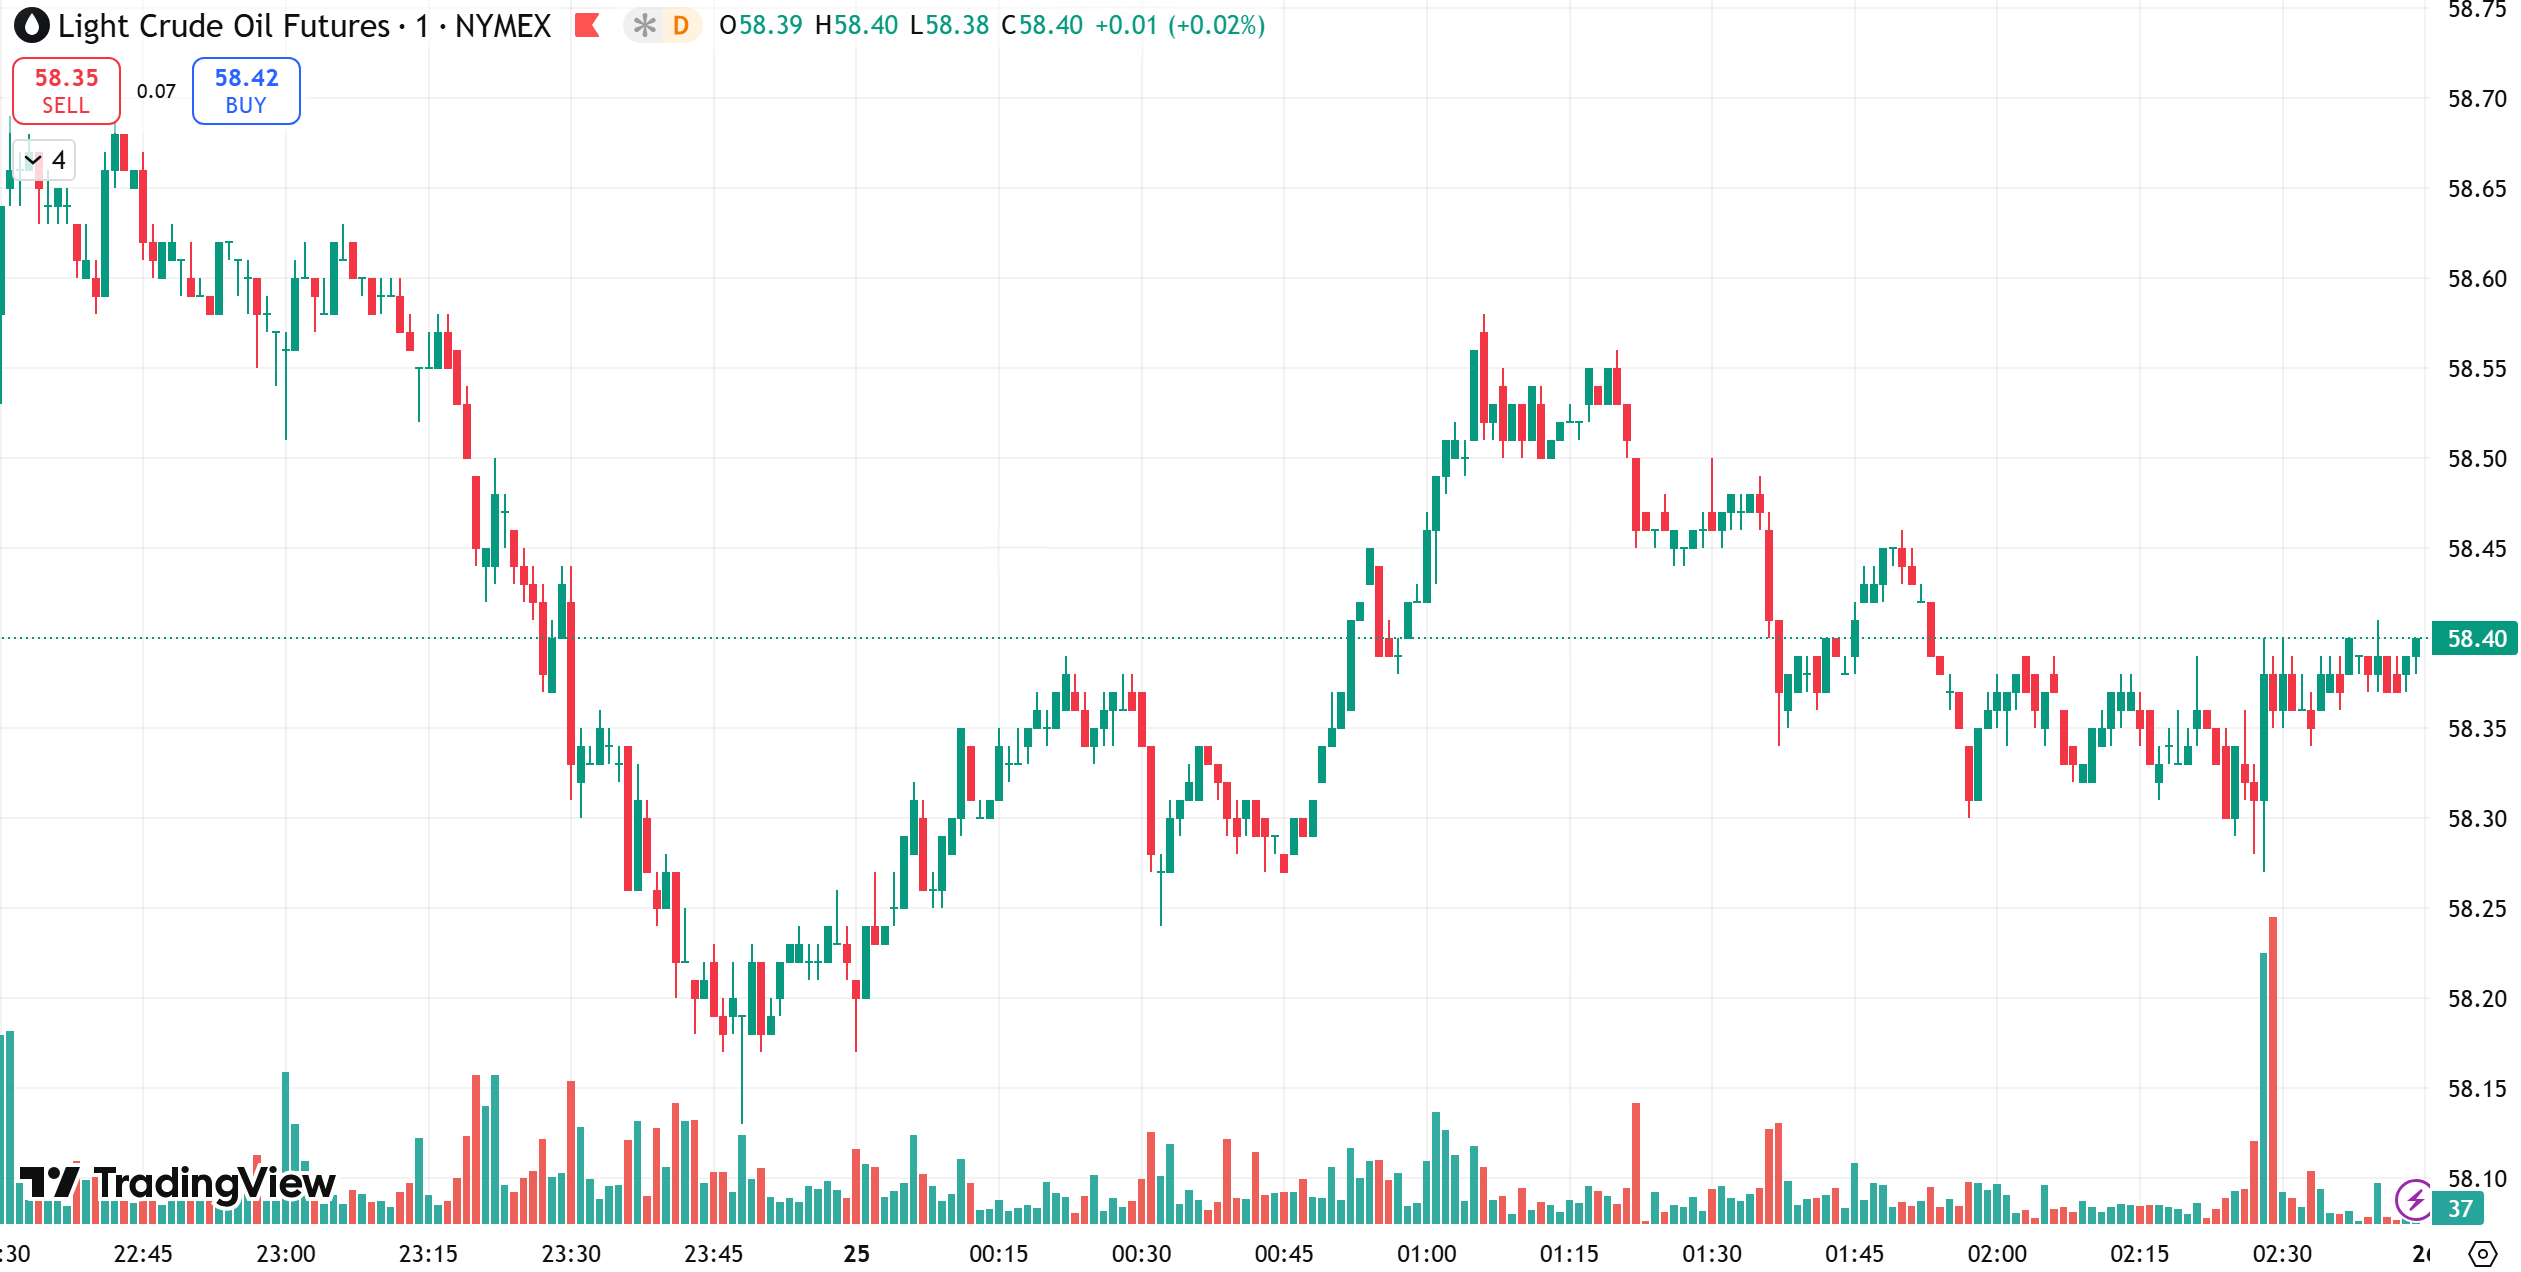
Oil prices edged lower on Wednesday, with Brent crude down 0.2% to $62.24 per barrel, while WTI slipped 0.05% to $58.35 per barrel.
Despite rebounding roughly 6% from near five-year lows reached on December 16, both benchmarks are still on track for steep annual losses. Brent and WTI are expected to finish the year down about 16% and 18%, respectively, marking their worst annual performance since the demand shock of 2020. The primary driver remains expectations that global oil supply will exceed demand in the coming year.
Recent price movements have been shaped by competing forces. On one hand, stronger-than-expected US economic data showed third-quarter growth reaching a two-year high, offering some support to demand expectations. On the other, rising geopolitical tensions, including US actions against Venezuelan oil shipments and continued attacks on energy infrastructure linked to the Russia–Ukraine conflict, have revived concerns about potential supply disruptions.
However, industry data indicated increases in US crude and refined product inventories last week. Official inventory figures from the US Energy Information Administration (EIA) have been delayed until next Monday due to the Christmas holiday.
From a technical standpoint, oil prices entered a consolidation phase after testing the $54.80 area. Daily charts show alternating candlesticks, with moving averages still pointing lower, keeping the medium-term trend bearish. Short-term (1H) price action continues to move higher, supported by the moving average system, suggesting near-term upward momentum remains intact.
However, momentum indicators such as the MACD are showing signs of bearish divergence, hinting that upside strength may be fading. While oil is currently trading within a short-term rebound, the broader downtrend remains dominant.
Focus today:
- Strategy: Buy on pullbacks, sell on rebounds
- Resistance: $59.5–$60.5
- Support: $57.0–$56.0
Risk Disclosure
Trading Securities, Futures, CFDs and other financial products involve high risks due to the rapid and unpredictable fluctuation in the value and prices of these underlying financial instruments. This unpredictability is due to the adverse and unpredictable market movements, geopolitical events, economic data releases, and other unforeseen circumstances. You may sustain substantial losses including losses exceeding your initial investment within a short period of time.
You are strongly advised to fully understand the nature and inherent risks of trading with the respective financial instrument before engaging in any transactions with us. When you engage in transactions with us, you acknowledge that you are aware of and accept these risks. You should conduct your own research and consult with an independent qualified financial advisor or professional before making any financial, trading or investment decisions. This blog may contain speculative statements regarding future expectations, plans, or projections based on information and assumptions currently available to D Prime. Although D Prime considers these assumptions reasonable, such statements involve risks, uncertainties, and factors beyond D Prime’s control, and actual outcomes may differ significantly.
Disclaimer
This information contained in this blog is for general informational purposes only and should not be considered as financial, investment, legal, tax or any other form of professional advice, recommendation, an offer, or an invitation to buy or sell any financial instruments. The content herein, including but not limited to data, analyses and market commentary, is presented based on internal records and/or publicly available information and may be subject to change or revision at anytime without notice and it does not consider any specific recipient’s investment objectives or financial situation. Past performance references are not reliable indicators of future performance.
D Prime and its affiliates make no representations or warranties about the accuracy or completeness of this information and disclaim any and all liability for any direct, indirect, incidental, consequential, or other losses or damages arising out of or in connection with the use of or reliance on any information contained in this blog. The above information should not be used or considered as the basis for any trading decisions or as an invitation to engage in any transaction.
D Prime does not guarantee the accuracy or completeness of this report and assumes no responsibility for any losses resulting from the use of this report. Do not rely on this report to replace your independent judgment. You should conduct your own research and consult with an independent qualified financial advisor or professional before making any financial, trading or investment decisions.

