Spot gold traded near $4,670.60/oz during early Asian hours on Tuesday after hitting a fresh record high of $4,690.46/oz on Monday. The rally was driven by rising safe-haven demand after U.S. President Donald Trump warned of potential tariffs on multiple European countries amid the Greenland dispute.
Meanwhile, WTI crude oil hovered around $59.36/barrel, holding largely steady. With domestic unrest in Iran easing, fears of U.S. military action against the major oil producer diminished, shifting market focus toward escalating U.S.-Europe trade tensions that could impact global demand.
Gold
Spot gold and silver both surged to record highs on Monday, fueled by heightened geopolitical and trade-related uncertainty following Trump’s tariff threats linked to the Greenland issue.
Spot gold climbed 1.7% to $4,672.49/oz, touching an intraday peak of $4,690.46/oz. February U.S. gold futures rose 1.8% to $4,677.70/oz.
Silver significantly outperformed, surging 5% and extending gains into Tuesday, reaching a new all-time high of $94.68/oz. Year-to-date, silver is now up nearly 32%.
The rally was directly triggered by rising geopolitical and trade risks. Trump previously threatened tariffs on Denmark, Sweden, France, Germany, and other European nations unless the U.S. is allowed to purchase Greenland.
XS senior market analyst Linh Tran noted:
“When institutional and policy risks resurface, markets react quickly by reallocating toward safe-haven assets, with gold once again becoming the preferred choice.”
Technical Outlook
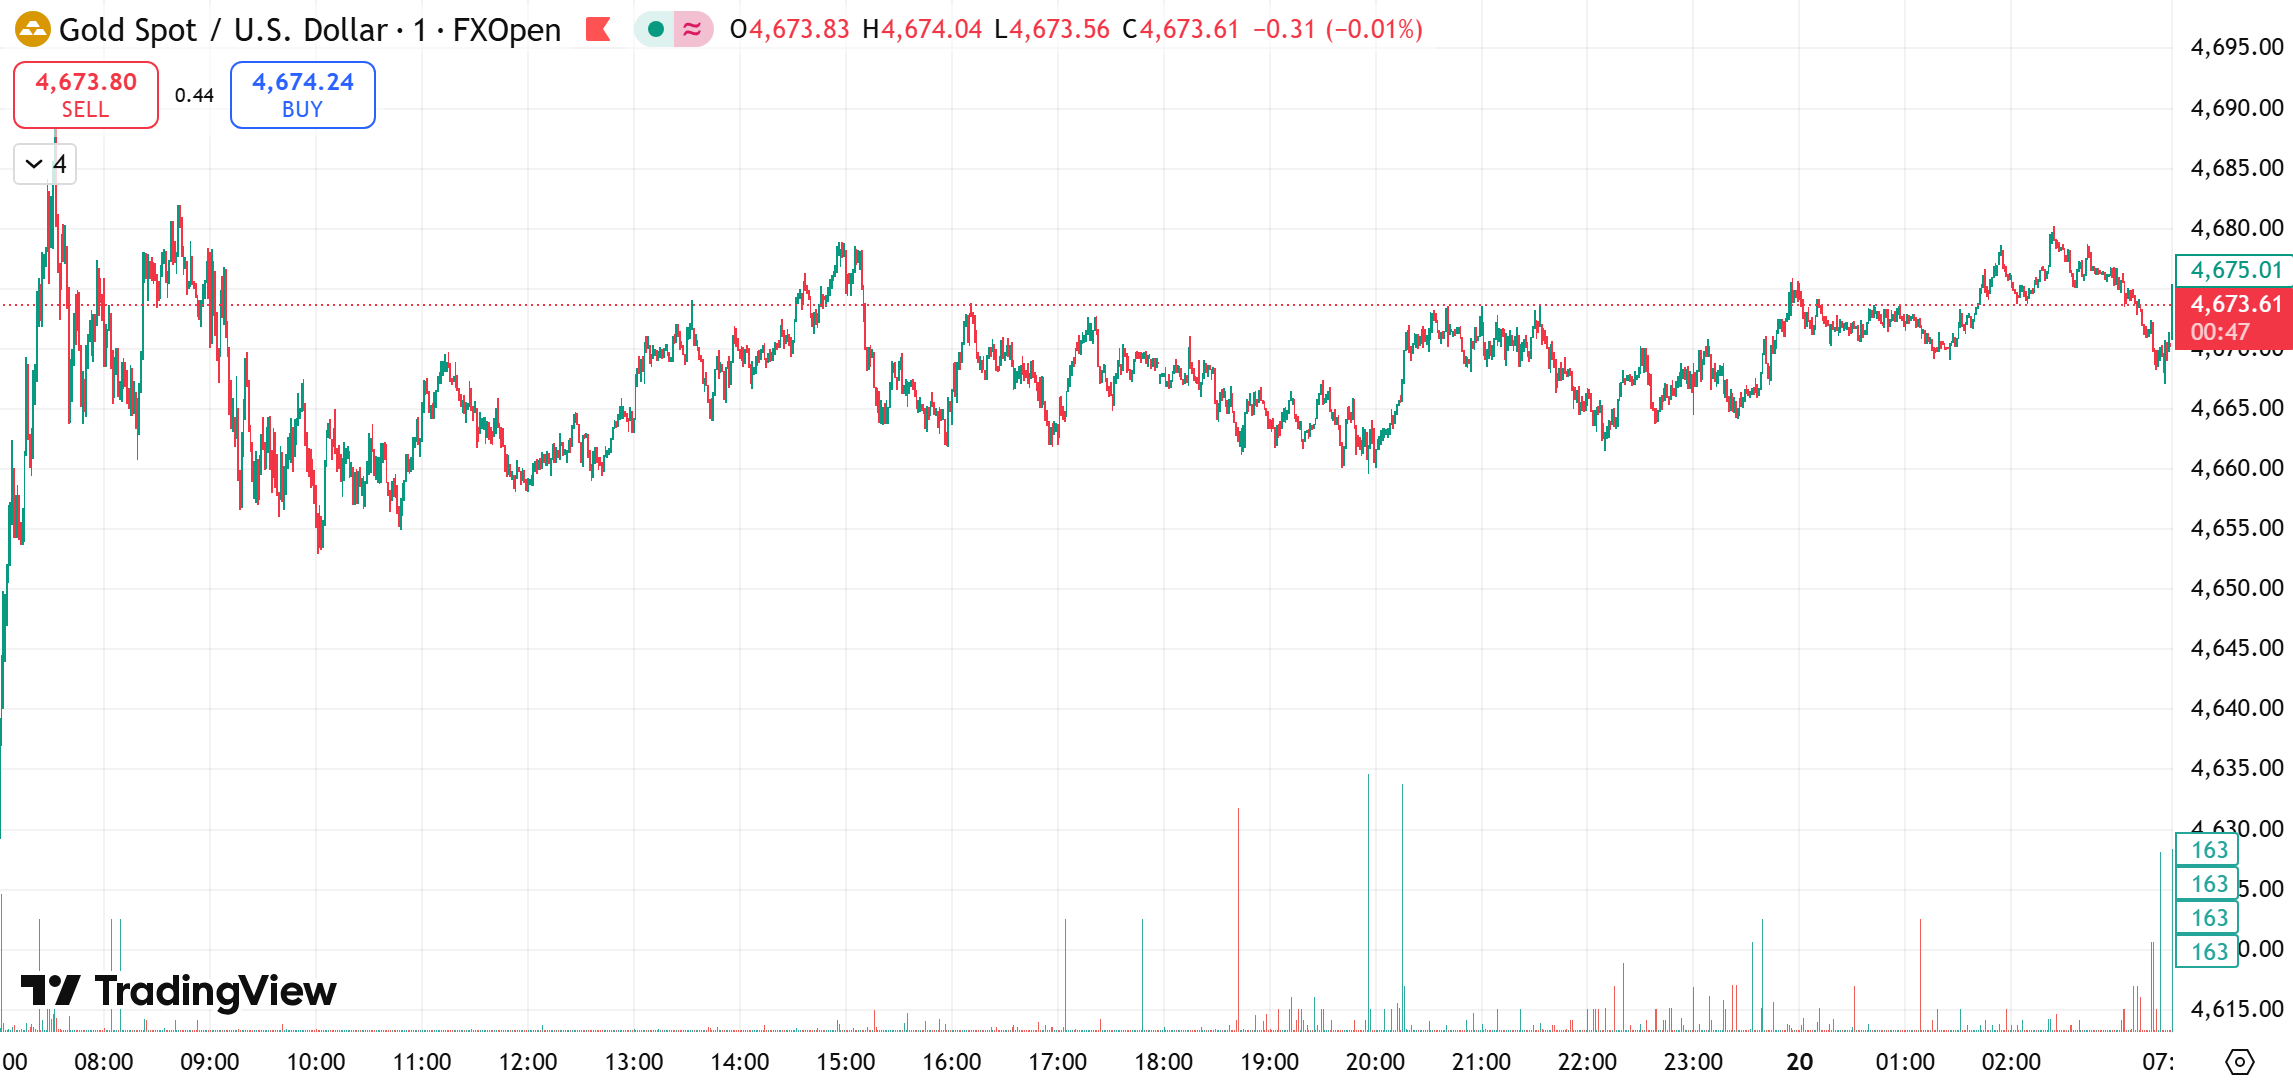
On the daily chart, gold remains in a strong bullish structure, with prices firmly above the 5-day and 10-day moving averages. As long as these supports hold, the technical trend remains decisively bullish.
Key downside support levels are seen at $4,620 and $4,580. Any pullback this week could gradually test these areas.
On the 4-hour chart, Bollinger Bands have begun to contract, with resistance near $4,690 and support around $4,580, aligning with daily retracement zones. Even if prices push slightly higher, a corrective phase remains possible at any time.
On the 1-hour timeframe, price action reflects high-level consolidation. Bollinger Bands are flattening, MACD has formed a bearish crossover with expanding negative bars, and RSI is retreating from overbought territory, suggesting short-term consolidation.
Today’s Focus:
Trading Bias: Buy on dips, sell on rallies
- Resistance: $4,690 – $4,700
- Support: $4,620 – $4,640
Crude Oil >>
Oil prices were largely unchanged on Monday as easing unrest in Iran reduced fears of U.S. military action that could disrupt supply. Attention has now shifted to rising U.S.-Europe trade tensions, which may weigh on demand.
Brent crude edged up 0.02% to $64.14/barrel, while WTI settled flat at $59.44/barrel. Trading volumes were thin due to a U.S. public holiday.
On one hand, geopolitical risk premiums faded as Iran managed to suppress protests and Trump appeared to walk back earlier intervention threats. On the other hand, new concerns emerged. Markets are increasingly focused on deteriorating U.S.-EU relations tied to the Greenland sovereignty dispute.
Trump has warned of tariffs on multiple European countries, while the EU has signaled readiness to retaliate and is preparing an emergency summit. Analysts warn that an expanding trade conflict could weaken global oil demand expectations.
Technical Outlook
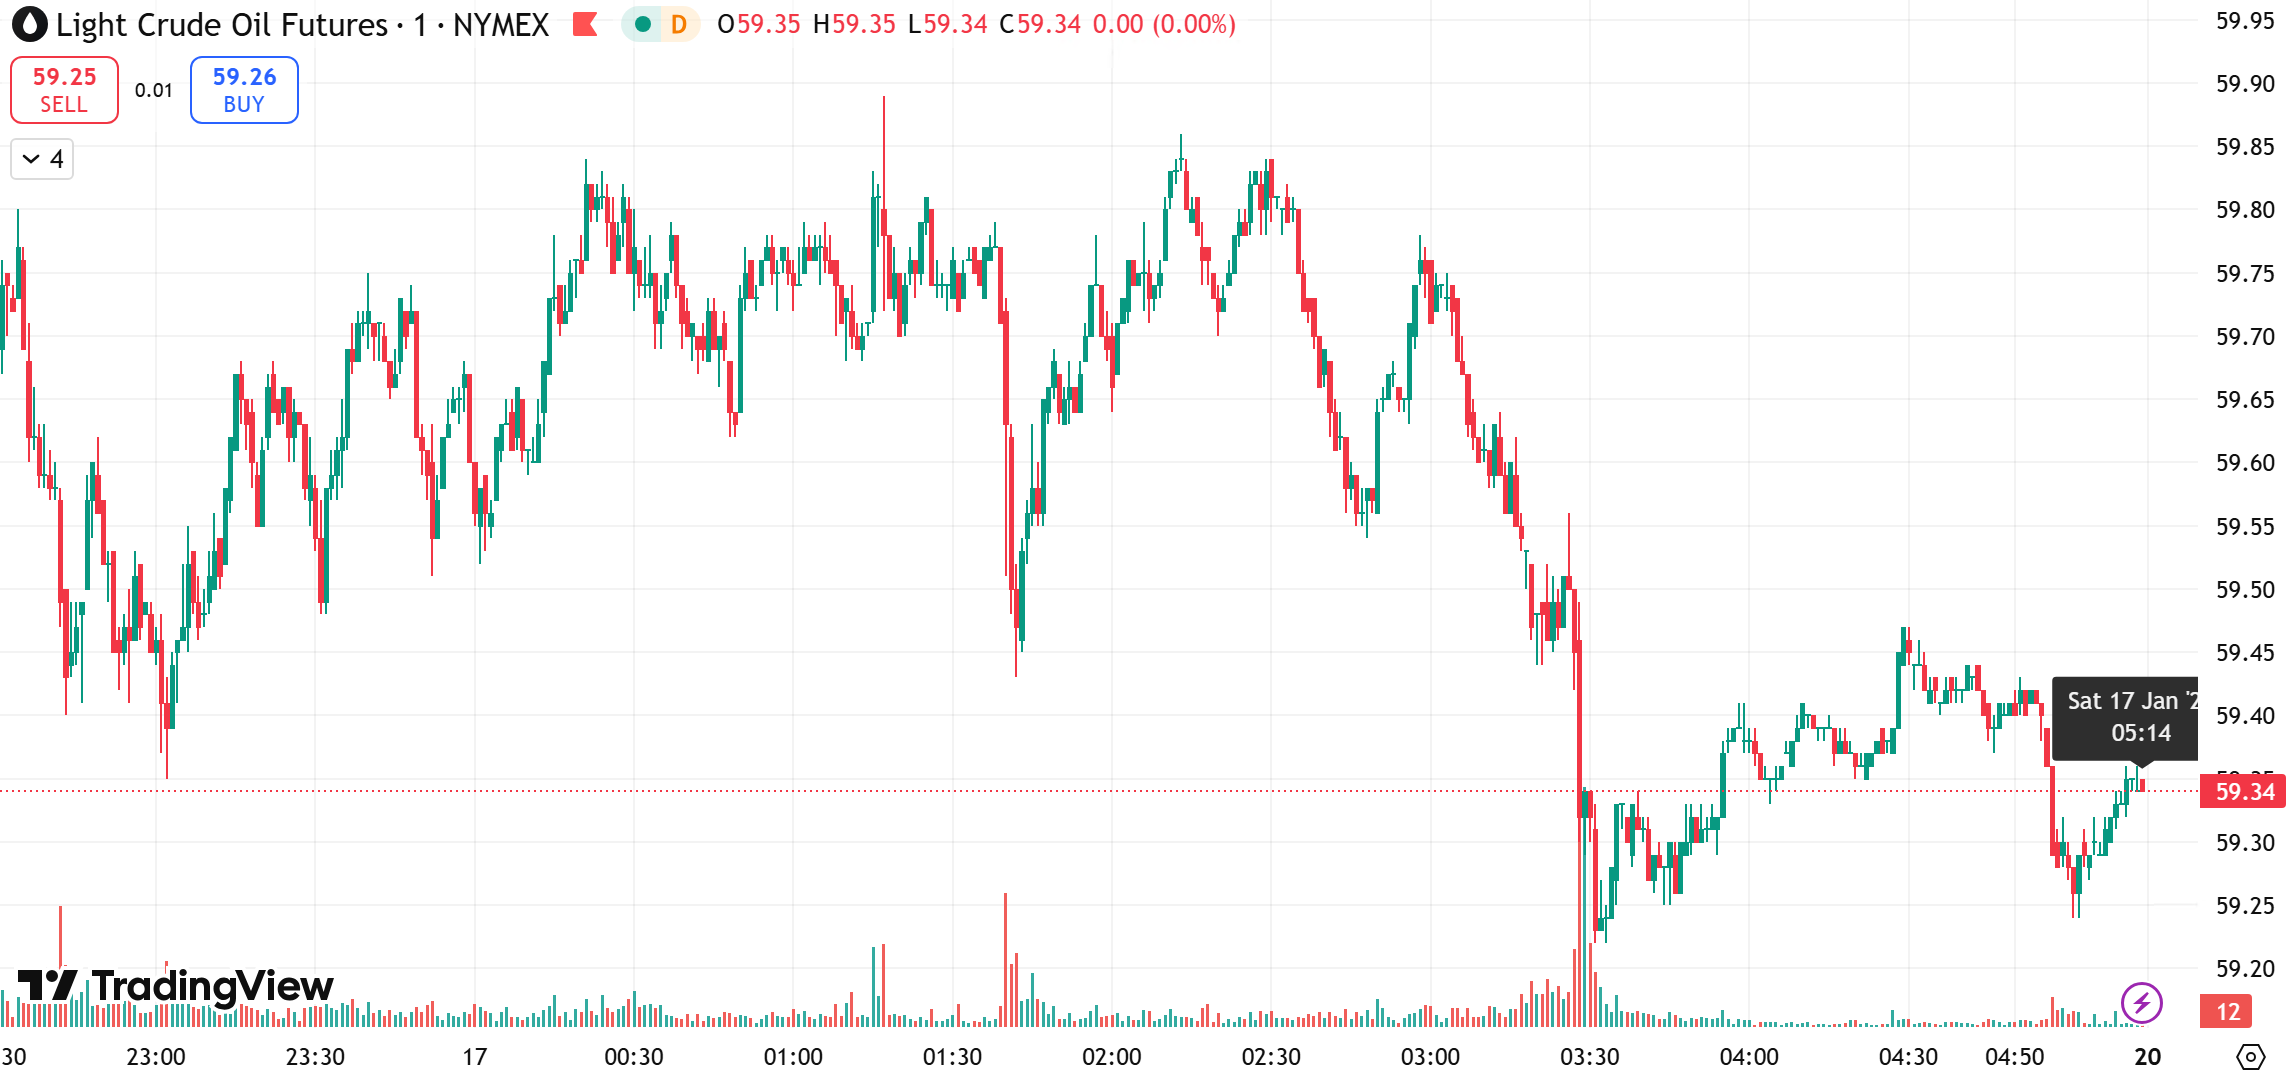
On the daily chart, oil opened lower near $58.90, rallied to $59.66, then pulled back to $58.64 before rebounding into the close at $59.54. The session formed a candlestick with a long lower shadow, suggesting potential stabilization and a tentative upside bias.
Today’s Focus:
Trading Bias: Sell on rallies, buy on dips
- Resistance: $60.5 – $61.5
- Support: $59.0 – $58.0
Risk Disclosure
Trading in Securities, Futures, contracts for difference (CFDs) and other financial products carries high risks due to the rapid and unpredictable fluctuation in the value and prices of these financial instruments. This unpredictability is due to the adverse and unpredictable market movements, geopolitical events, economic data releases, and other unforeseen circumstances. You may sustain substantial losses including losses exceeding your initial investment within a short period of time.
You are strongly advised to fully understand the nature and inherent risks of trading with the respective financial instrument before engaging in any transactions with us. When you engage in transactions with us, you acknowledge that you are aware of and accept these risks. You should conduct your own research and consult with an independent qualified financial advisor or professional before making any financial, trading or investment decisions. This blog may contain speculative statements regarding future expectations, plans, or projections based on information and assumptions currently available to D Prime. Although D Prime considers these assumptions reasonable, such statements involve risks, uncertainties, and factors beyond D Prime’s control, and actual outcomes may differ significantly.
Disclaimer
This information contained in this blog is for general informational purposes only and should not be considered as financial, investment, legal, tax or any other form of professional advice, recommendation, an offer, or an invitation to buy or sell any financial instruments. The content herein, including but not limited to data, analyses and market commentary, is presented based on internal records and/or publicly available information and may be subject to change or revision at anytime without notice and it does not consider any specific recipient’s investment objectives or financial situation. Past performance references are not reliable indicators of future performance.
D Prime and its affiliates make no representations or warranties about the accuracy or completeness or reliability of this information and disclaim any and all liability for any direct, indirect, incidental, consequential, or other losses or damages arising out of or in connection with the use of or reliance on any information contained in this blog. The above information should not be used or considered as the basis for any trading decisions or as an invitation to engage in any transaction. Do not rely on this report to replace your independent judgment. You should conduct your own research and consult with an independent qualified financial advisor or professional before making any financial trading or investment decisions.

