Market Recap
On Tuesday, spot gold rose to $3,767.60 per ounce, briefly hitting a new record high of $3,790.97. Safe-haven demand surged amid geopolitical uncertainty and expectations of further Fed rate cuts. Meanwhile, US crude traded near $63.77 per barrel, gaining more than 2% after negotiations to resume Iraqi Kurdish oil exports hit a deadlock, easing concerns about oversupply.
Gold
Gold extended gains on Tuesday, setting another record. Spot gold rose 0.8% to $3,777.80 per ounce after touching $3,790.97 earlier in the session. December US gold futures settled 1.1% higher at $3,815.70.
US 10-year Treasury yields fell 0.2%, while the dollar held steady. Fed Chair Jerome Powell described the outlook as a “challenging situation,” warning of upside inflation risks and softening job growth. He gave few hints about the timing of the next cut.
Bob Haberkorn, Market Strategist at RJO Futures, said: “Powell’s comments added nothing new compared to last week, and nothing significant enough to change gold’s upward trajectory.” Traders still expect rate cuts in both October and December. Attention now shifts to Friday’s PCE price index, the Fed’s preferred inflation gauge.
Gold Technical Outlook:
Daily charts show prices climbing along the upper Bollinger Band, a classic sign of a strong trending move. The band width is expanding, signaling rising volatility. Key levels:
- Historical high: $3,790.97 (current price magnet)
- Support: $3,690.00 (former resistance turned support; break below could trigger a test of mid-band at $3,544.67)
Gold Key Levels:
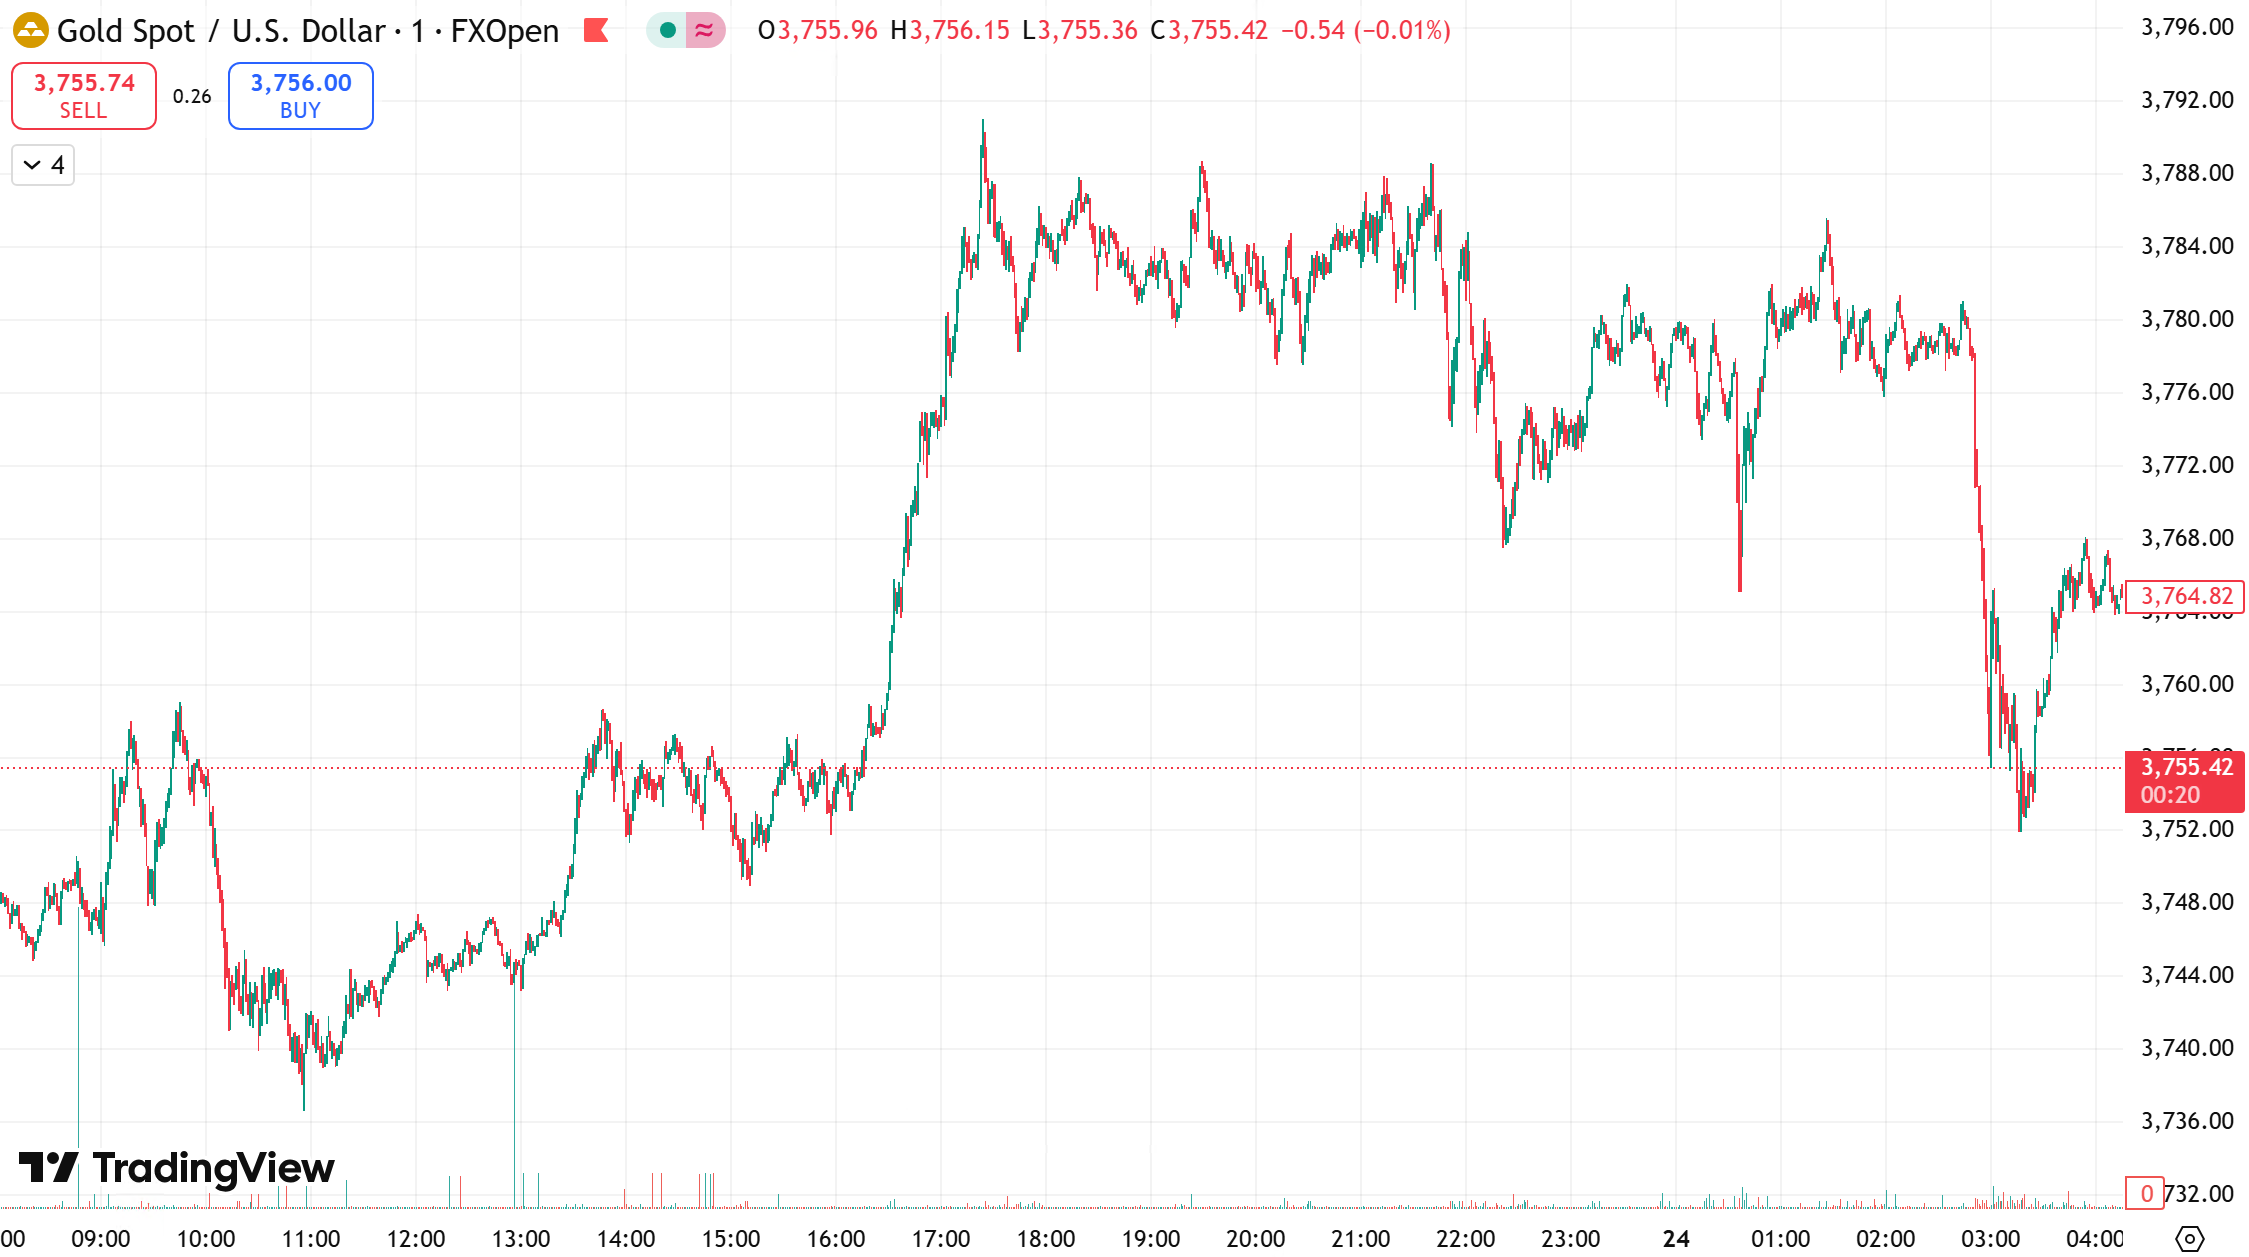
- Resistance: $3,780–$3,790
- Support: $3,750–$3,740
Strategy: Buy on dips, sell on rebounds.
Oil
Crude oil rebounded over $1 per barrel as stalled talks over Kurdish exports prevented an expected resumption of flows through the Turkey pipeline.
Brent futures rose 1.6% to $67.63, while WTI gained 1.8% to $63.41. Both benchmarks reversed earlier losses, snapping a four-day losing streak that had erased 3%.
Phil Flynn, Senior Analyst at Price Futures Group, said: “This is a classic case of counting barrels before the oil leaves the ground. The market sold off on expectations of a deal, but since no agreement was reached, that oil effectively disappeared from supply.”
UBS analyst Giovanni Staunovo added: OECD crude inventories remain low, providing support, though rising OPEC+ exports and the absence of fresh sanctions on Russian oil continue to pressure prices.
Oil Technical Outlook:
Daily charts show oil stabilizing after consecutive declines, forming a narrow base. Short-term momentum remains weak, with 1H charts showing a dip to $61.30 before a minor rebound. Moving averages remain bearish, but MACD signals suggest weakening downside momentum. A small corrective bounce may precede further declines.
Oil Key Levels:
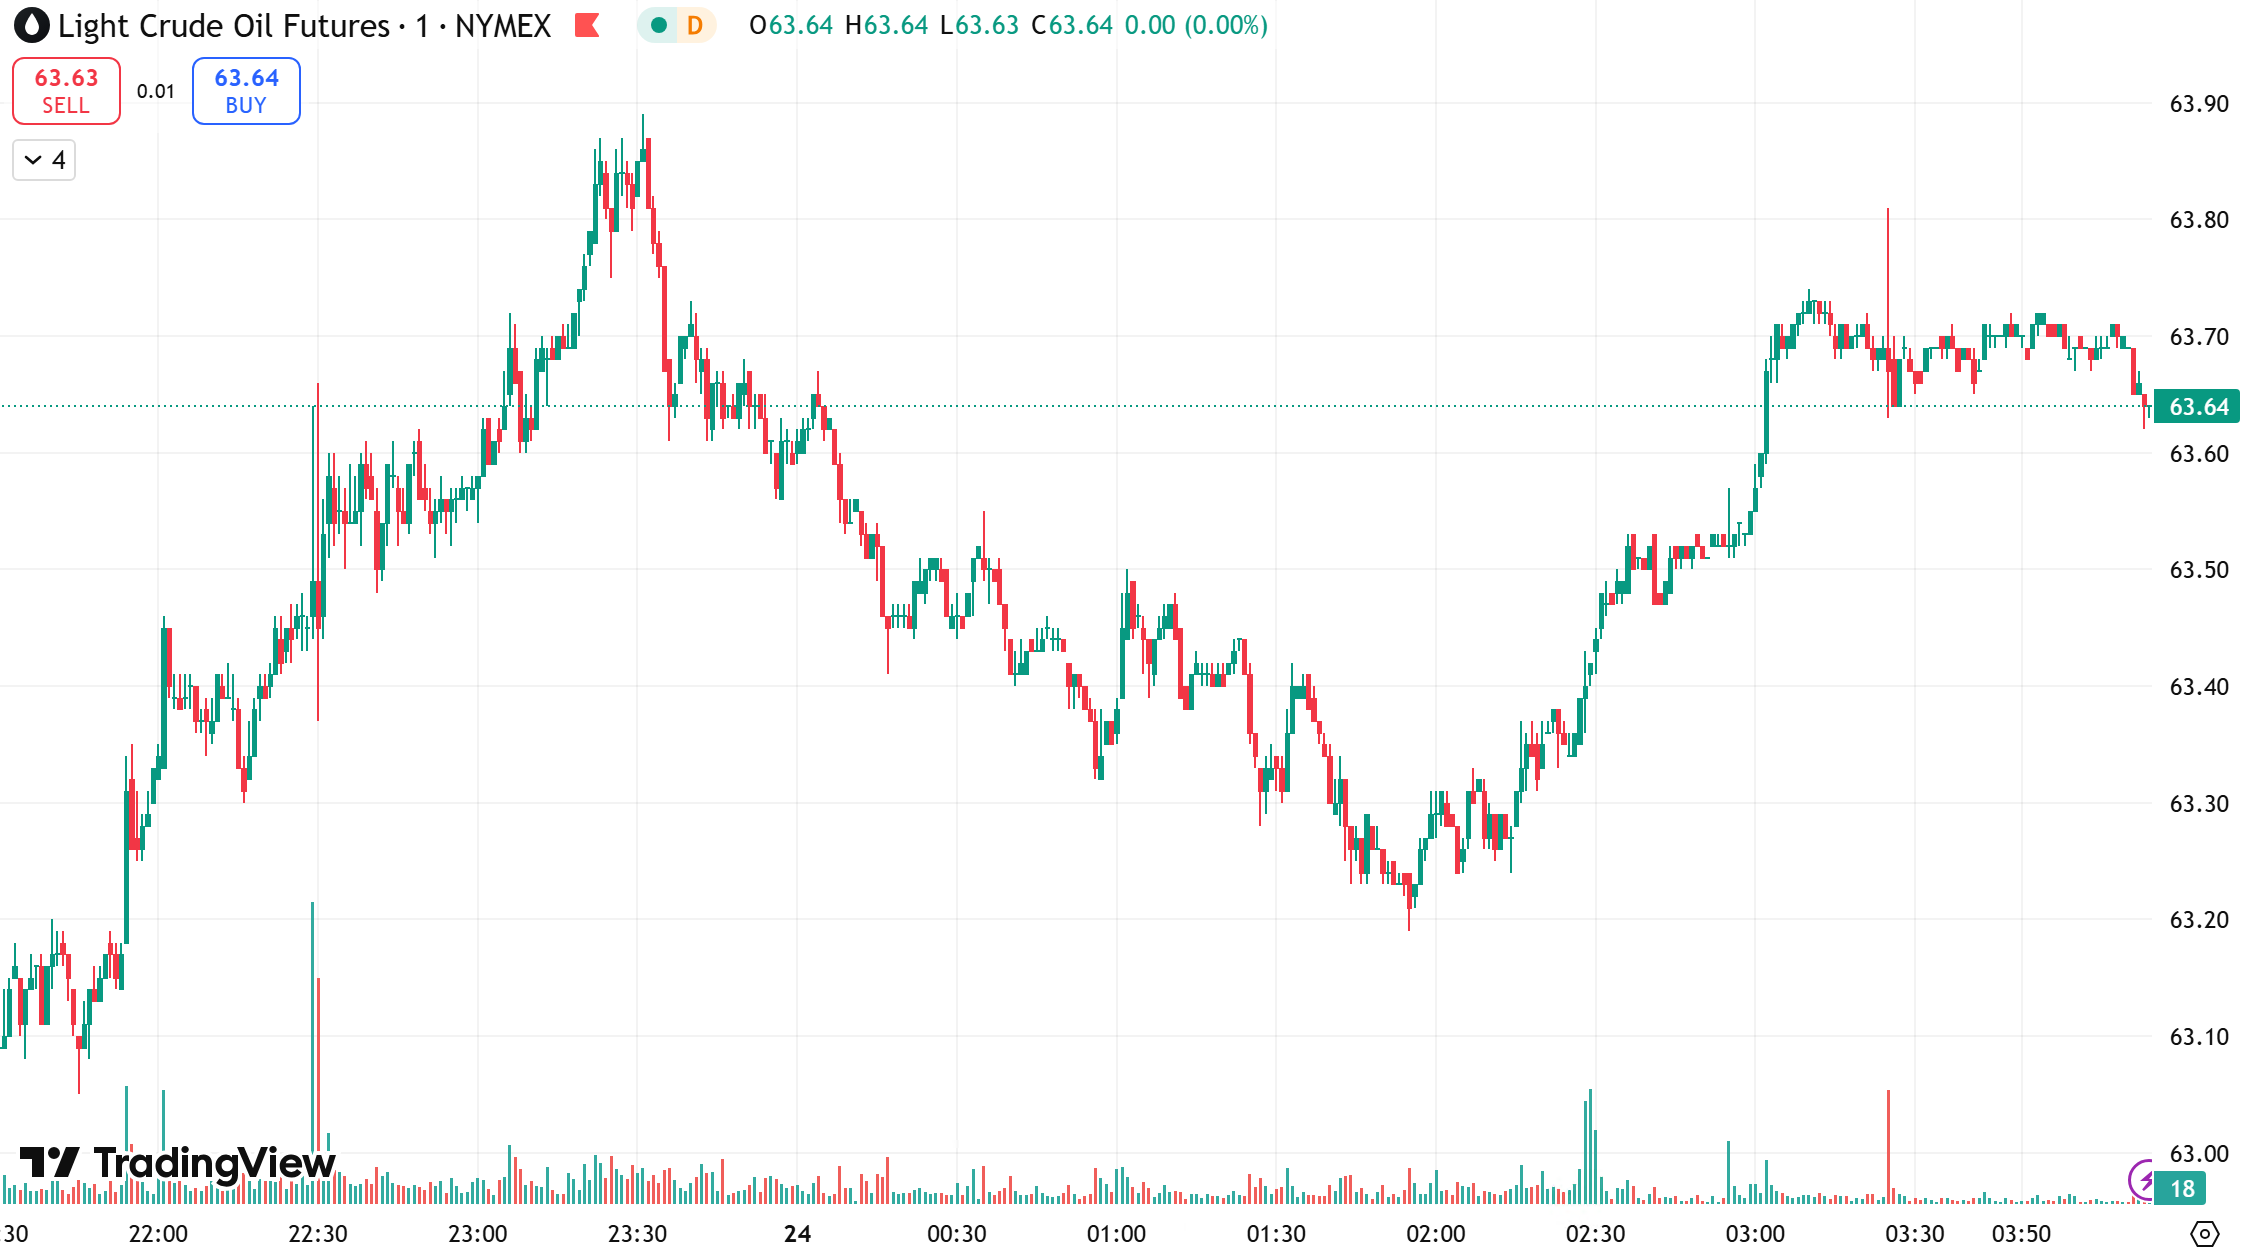
- Resistance: $65.0–$66.0
- Support: $62.5–$61.5
Strategy: Sell on rebounds, buy selectively on dips.
Risk Disclosure
Securities, Futures, CFDs and other financial products involve high risks due to the fluctuation in the value and prices of the underlying financial instruments. Due to the adverse and unpredictable market movements, large losses exceeding your initial investment could incur within a short period of time.
Please make sure you fully understand the risks of trading with the respective financial instrument before engaging in any transactions with us. You should seek independent professional advice if you do not understand the risks explained herein.
Disclaimer
This information contained in this blog is for general reference only and is not intended as investment advice, a recommendation, an offer, or an invitation to buy or sell any financial instruments. It does not consider any specific recipient’s investment objectives or financial situation. Past performance references are not reliable indicators of future performance. D Prime and its affiliates make no representations or warranties about the accuracy or completeness of this information and accept no liability for any losses or damages resulting from its use or from any investments made based on it.
The above information should not be used or considered as the basis for any trading decisions or as an invitation to engage in any transaction. D Prime does not guarantee the accuracy or completeness of this report and assumes no responsibility for any losses resulting from the use of this report. Do not rely on this report to replace your independent judgment. The market is risky, and investments should be made with caution.

