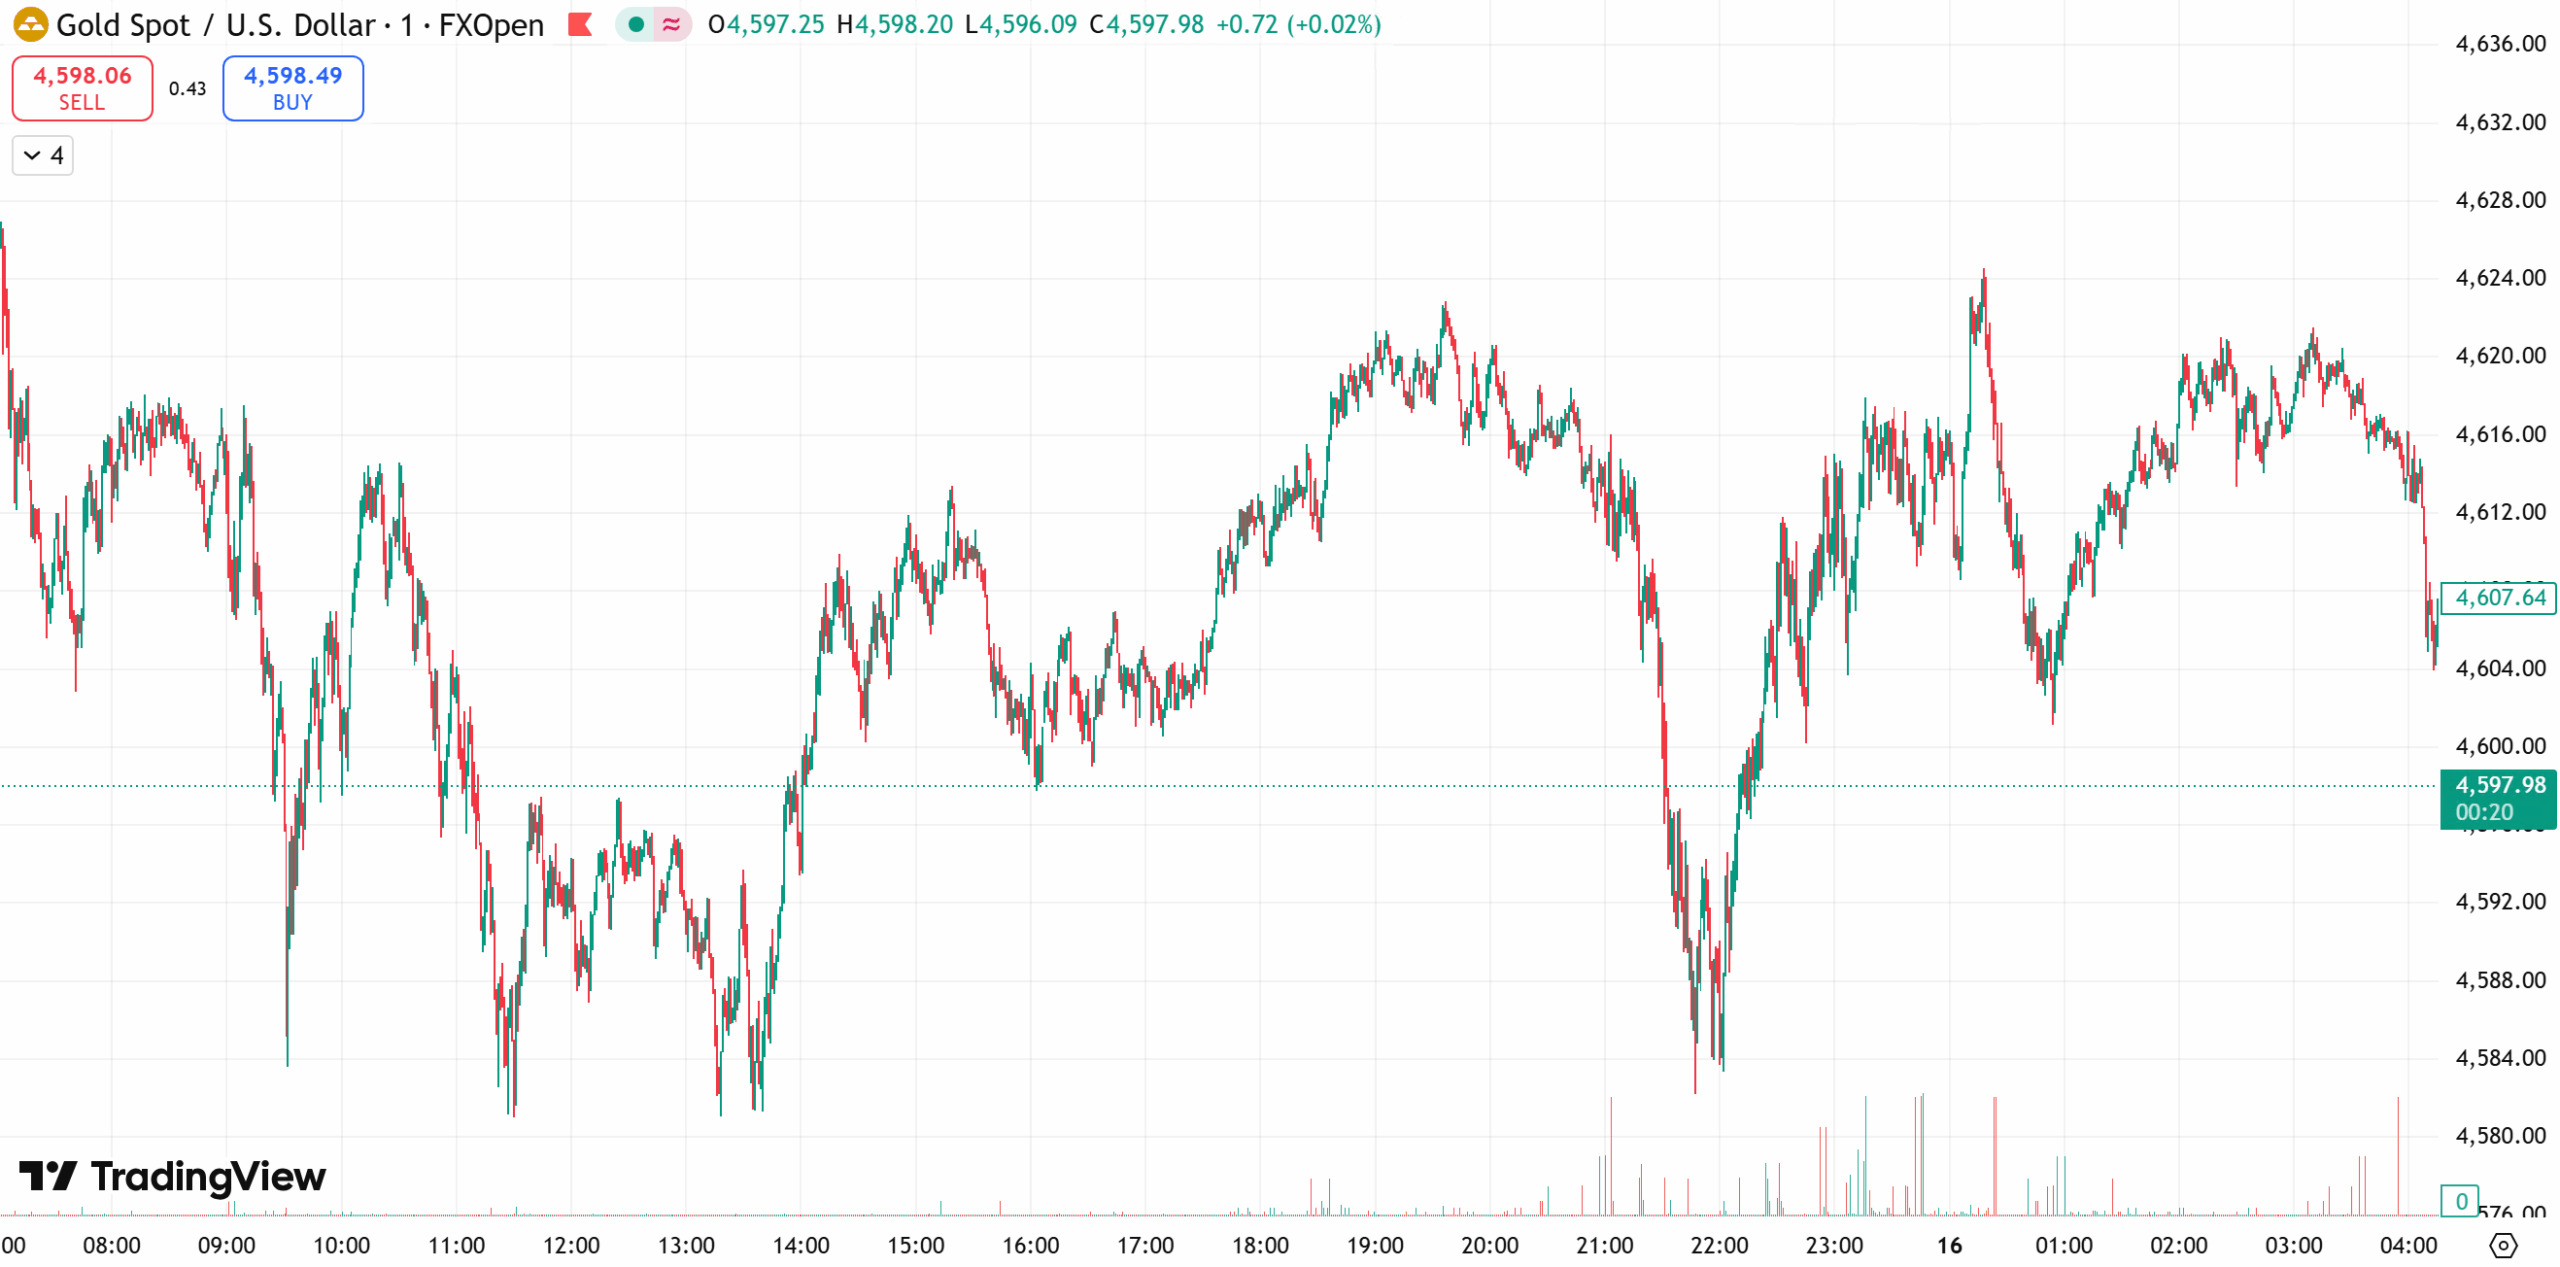
Early Friday in Asian trading, spot gold was hovering around $4,613.90 per ounce. Gold retreated from record highs on Thursday after strong US labor market data and signs of easing geopolitical tensions.
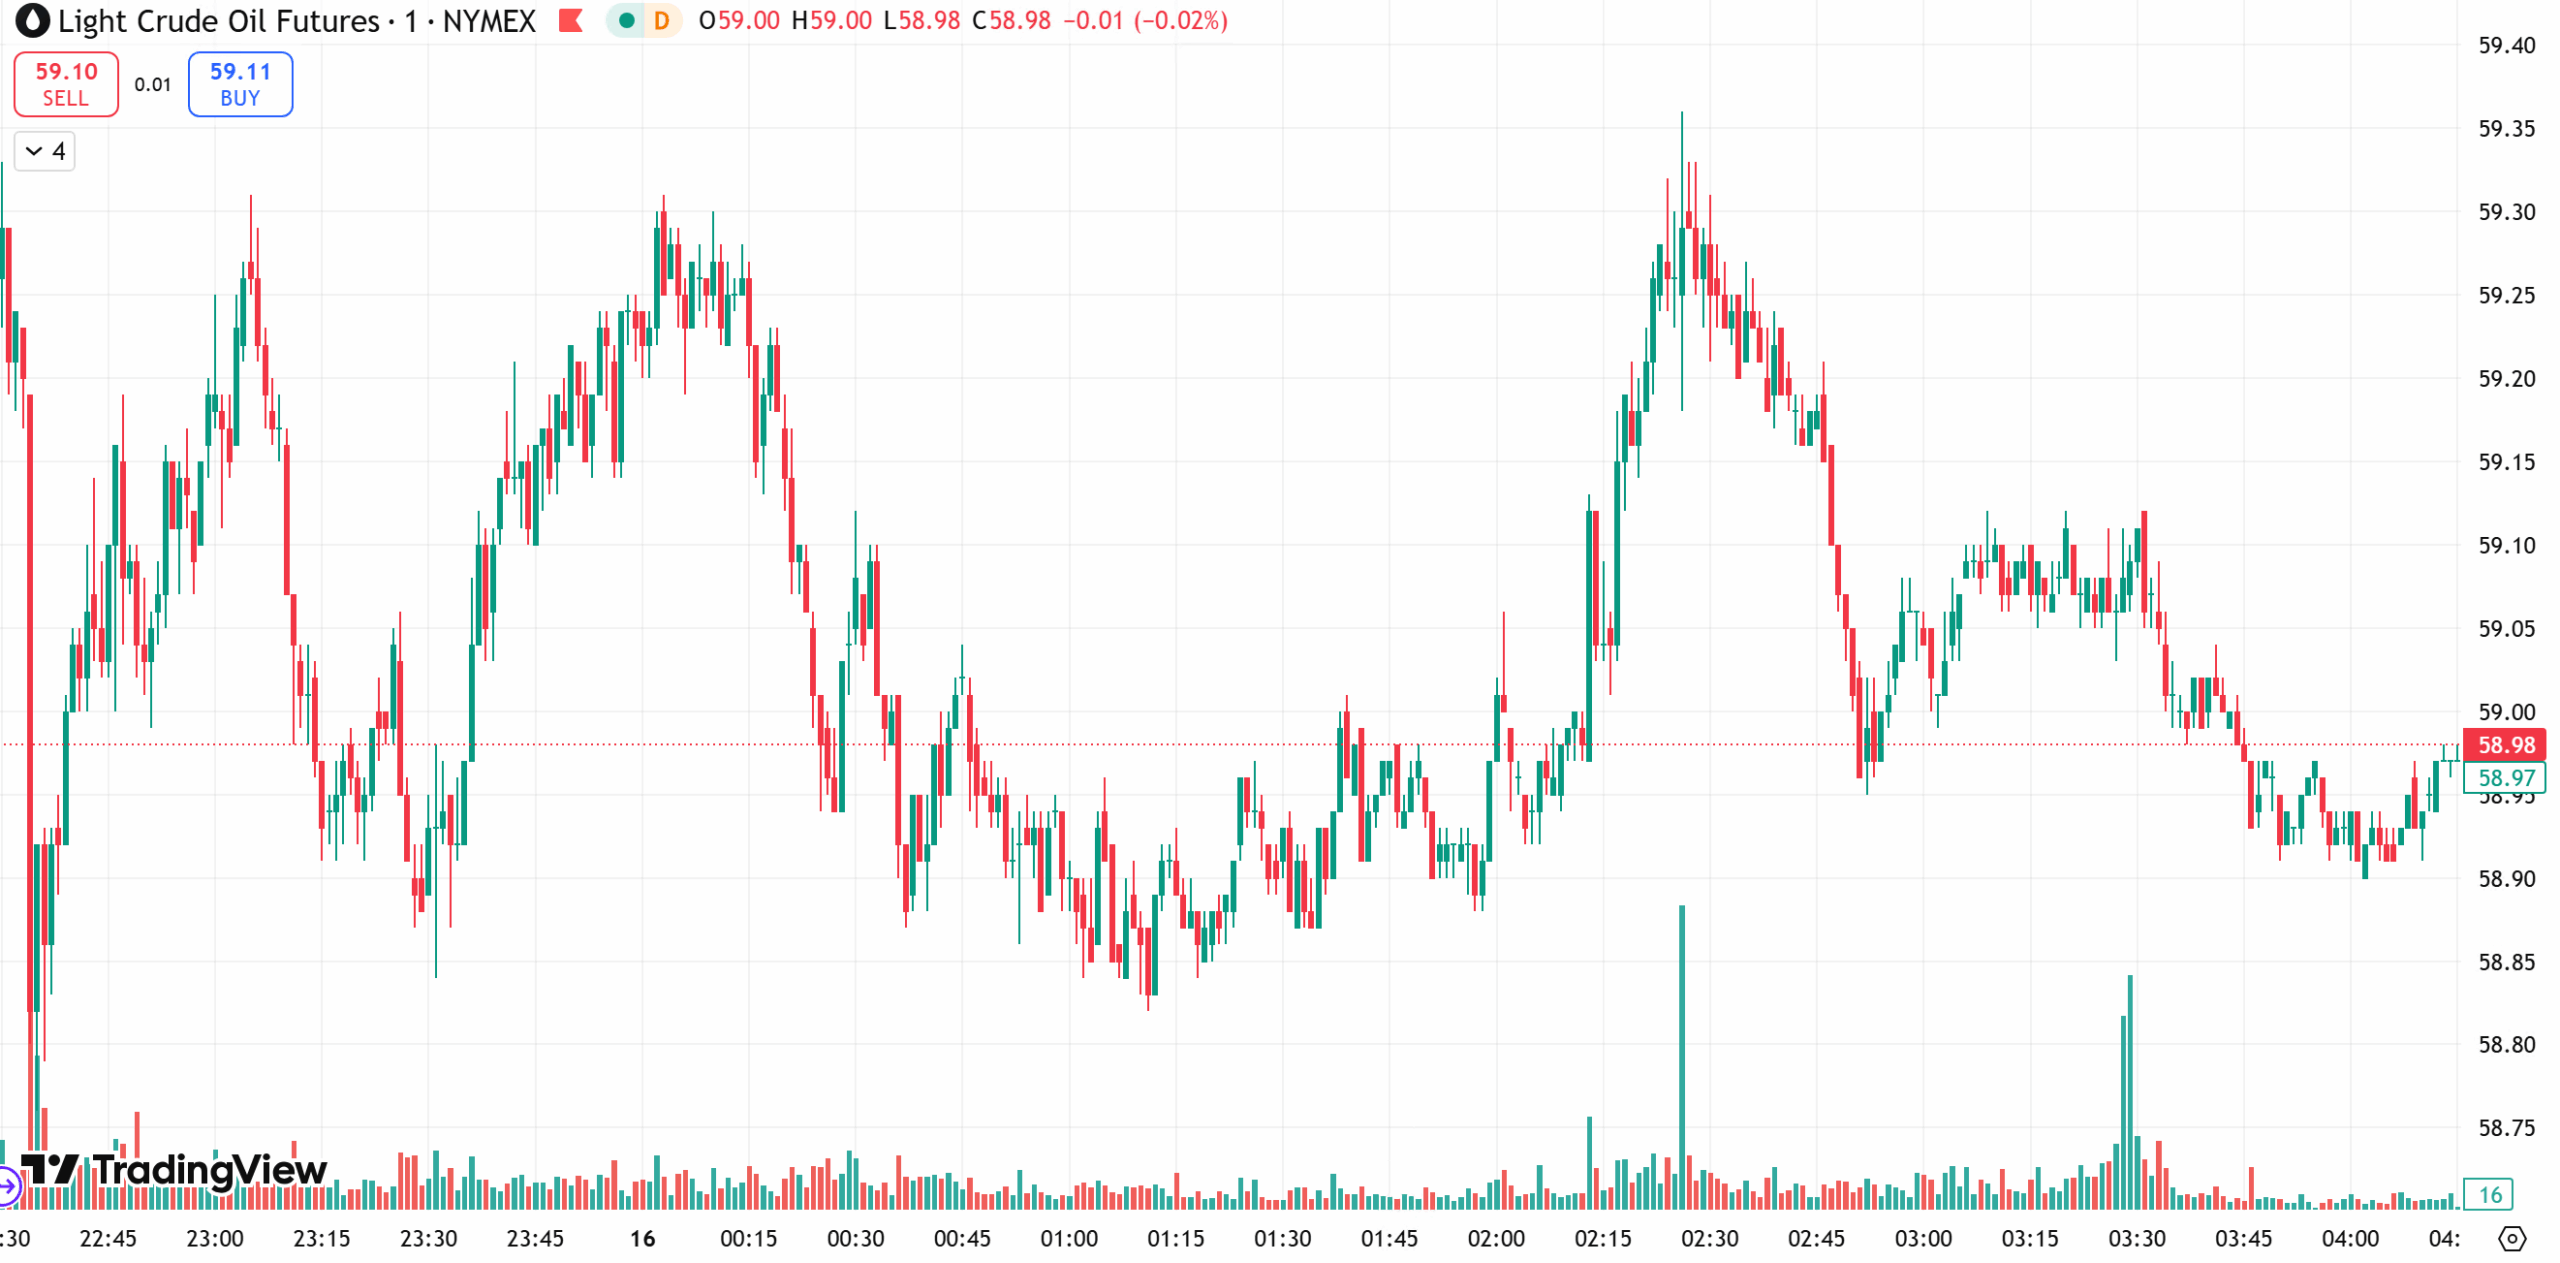
Meanwhile, US crude was trading near $59.08 per barrel, with oil prices plunging more than 3% on Thursday, snapping a five-day winning streak, pressured by President Trump’s comments suggesting easing tensions with Iran and a sharp rise in US crude inventories.
Gold
Gold pulled back from record highs on Thursday, weighed down by strong US employment data and reduced geopolitical risk. Spot gold slipped 0.1% to $4,614.93 per ounce, while US gold futures fell 0.3% to $4,623.70 per ounce.
The decline was driven by two main factors. First, US weekly jobless claims unexpectedly fell, pushing the US dollar index to a multi-week high. A stronger dollar makes gold more expensive for holders of other currencies.
Second, safe-haven demand eased after President Trump said Iran’s handling of domestic protests appeared to be calming, signaling a possible pause in escalation, which reduced gold’s appeal as a risk hedge.
Trump also stated that there are no immediate plans to remove Federal Reserve Chair Jerome Powell, though he did not rule out the possibility in the future. Markets broadly expect the Fed to keep rates unchanged at its upcoming meeting, while still pricing in at least two rate cuts later this year, which continues to provide longer-term support for gold.
From a technical perspective, gold remains in a high-level consolidation phase on the 4-hour chart, with prices currently oscillating between $4,580 and $4,640. Short-term moving averages have flattened and converged, suggesting a consolidation bias.
On the 1-hour chart, $4,580 remains a key support level. After the recent pullback, prices have gradually stabilized, short-term moving averages are starting to turn higher, and candles are moving back above these averages, indicating potential for further short-term rebound, pending confirmation of follow-through.
Today’s Focus:
Trading strategy favors buying on pullbacks, with selling on rallies as a secondary approach.
- Short-term resistance: $4,630–$4,650
- Short-term support: $4,580–$4,560
Oil
Oil prices dropped sharply on Thursday, falling more than 3% and ending a five-day rally, as markets reacted to Trump’s comments signaling easing tensions with Iran, combined with a surge in US crude inventories.
Brent crude slid 4.15% to $63.76 per barrel, while WTI crude tumbled 4.56% to $59.19 per barrel. The sell-off reflected a rapid unwinding of geopolitical risk premiums.
Trump said he had been informed that Iran’s actions during domestic unrest were easing, with no signs of large-scale executions, signaling a more cautious US stance. Analysts noted this significantly reduced short-term fears of escalation between the US and Iran, as well as concerns over disruptions to Iranian oil supply.
Technically, on the daily chart, oil had previously broken above $60.50, but follow-through was weak, keeping prices locked in a volatile consolidation range with downside risk still present.
On the 1-hour chart, oil reversed sharply after touching $62.20, forming a large bearish candle that erased most of the day’s gains. Short-term momentum has shifted into a choppy, range-bound structure, and the probability of an immediate breakout to new highs remains low.
Today’s Focus:
Trading strategy favors selling on rebounds, with buying on dips as a secondary approach.
- Short-term resistance: $60.5–$61.5
- Short-term support: $58.0–$57.0
Risk Disclosure
Trading in Securities, Futures, contracts for difference (CFDs) and other financial products carries high risks due to the rapid and unpredictable fluctuation in the value and prices of these financial instruments. This unpredictability is due to the adverse and unpredictable market movements, geopolitical events, economic data releases, and other unforeseen circumstances. You may sustain substantial losses including losses exceeding your initial investment within a short period of time.
You are strongly advised to fully understand the nature and inherent risks of trading with the respective financial instrument before engaging in any transactions with us. When you engage in transactions with us, you acknowledge that you are aware of and accept these risks. You should conduct your own research and consult with an independent qualified financial advisor or professional before making any financial, trading or investment decisions. This blog may contain speculative statements regarding future expectations, plans, or projections based on information and assumptions currently available to D Prime. Although D Prime considers these assumptions reasonable, such statements involve risks, uncertainties, and factors beyond D Prime’s control, and actual outcomes may differ significantly.
Disclaimer
This information contained in this blog is for general informational purposes only and should not be considered as financial, investment, legal, tax or any other form of professional advice, recommendation, an offer, or an invitation to buy or sell any financial instruments. The content herein, including but not limited to data, analyses and market commentary, is presented based on internal records and/or publicly available information and may be subject to change or revision at anytime without notice and it does not consider any specific recipient’s investment objectives or financial situation. Past performance references are not reliable indicators of future performance.
D Prime and its affiliates make no representations or warranties about the accuracy or completeness or reliability of this information and disclaim any and all liability for any direct, indirect, incidental, consequential, or other losses or damages arising out of or in connection with the use of or reliance on any information contained in this blog. The above information should not be used or considered as the basis for any trading decisions or as an invitation to engage in any transaction. Do not rely on this report to replace your independent judgment. You should conduct your own research and consult with an independent qualified financial advisor or professional before making any financial trading or investment decisions.

