Market Update
Spot gold traded near 4280 dollars per ounce on Thursday, surging to its highest level in more than a month after the Federal Reserve’s rate cut and continued weakness in the US dollar. Gold touched 4285.75 dollars, while silver skyrocketed to a record high of 64.28 dollars. The US Dollar Index fell to an eight-week low, boosting precious metals.
WTI crude traded near 57.93 dollars per barrel, falling on Thursday as geopolitical shifts and rising US fuel inventories added pressure to oil markets.
Gold
Precious metals strengthened on Thursday, with gold climbing to a one-month high and silver breaking yet another all-time record.
Spot gold rose 1.2 percent to 4285.75 dollars, the highest since October 21. Gold futures gained 2.1 percent, settling at 4313 dollars.
Silver surged nearly 4 percent to 64.22 dollars, briefly touching a historic 64.28 dollars intraday.
Analysts highlighted the weaker US dollar as the primary driver, making USD-priced metals cheaper for overseas buyers. Silver’s explosive momentum also supported broader precious metals. Historically, rate cuts while inflation remains above target tend to benefit gold.
The Fed delivered its third rate cut of the year but signaled it may pause to monitor labor market and inflation trends. Market attention now turns to the December 16 nonfarm payrolls report for clues on the Fed’s next steps.
Gold Technical Outlook
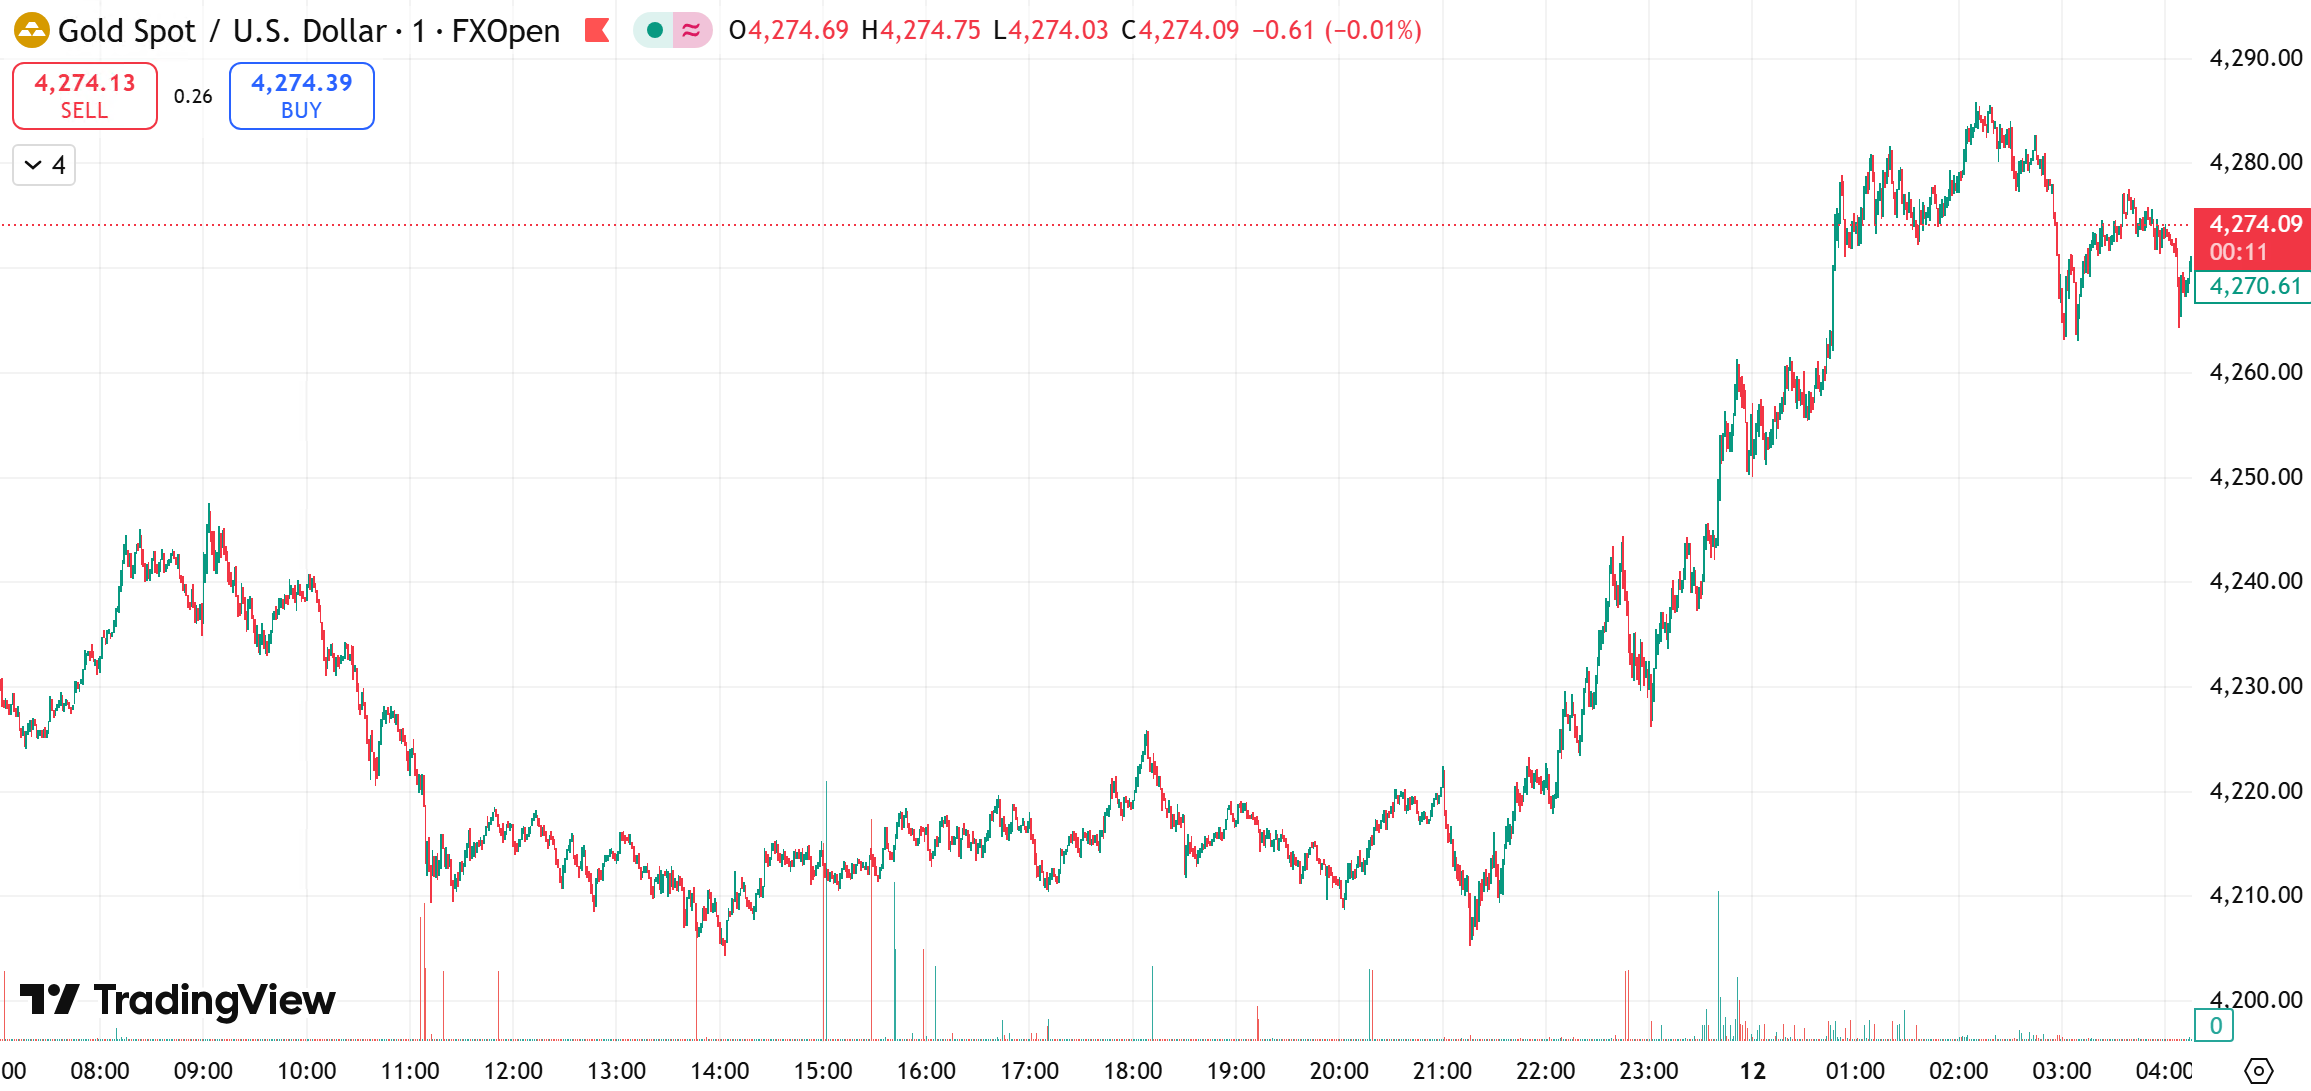
Gold has broken above its previous range and is firmly holding above the 4200 level, confirming strong bullish momentum. Price action shows consecutive bullish closes, MACD expansion, and healthy RSI positioning.
Daily structure shows three consecutive small-body bullish candles, a steady continuation pattern.
Bollinger Bands are opening upward, with upper resistance near 4285, suggesting potential for another upside breakout if momentum builds.
Today’s Gold Levels
Bias: Buy the dip; sell small rebounds
• Resistance: 4300–4320
• Support: 4255–4235
Crude Oil
Oil declined on Thursday as geopolitical developments and rising US fuel inventories weighed on sentiment.
Brent crude fell 1.49 percent to 61.28 dollars, while WTI slid 1.47 percent to 57.60 dollars. Both benchmarks briefly broke below their October lows.
EIA data showed gasoline and distillate stocks each rising by roughly 2.5 million barrels, signaling oversupply in refined products and weakening demand expectations.
Markets also weighed the potential for a Russia-Ukraine peace agreement, which could bring more Russian crude back into global supply chains.
However, the US seizure of an oil tanker near Venezuela underscored ongoing geopolitical risks that could interrupt flows.
Technical Outlook
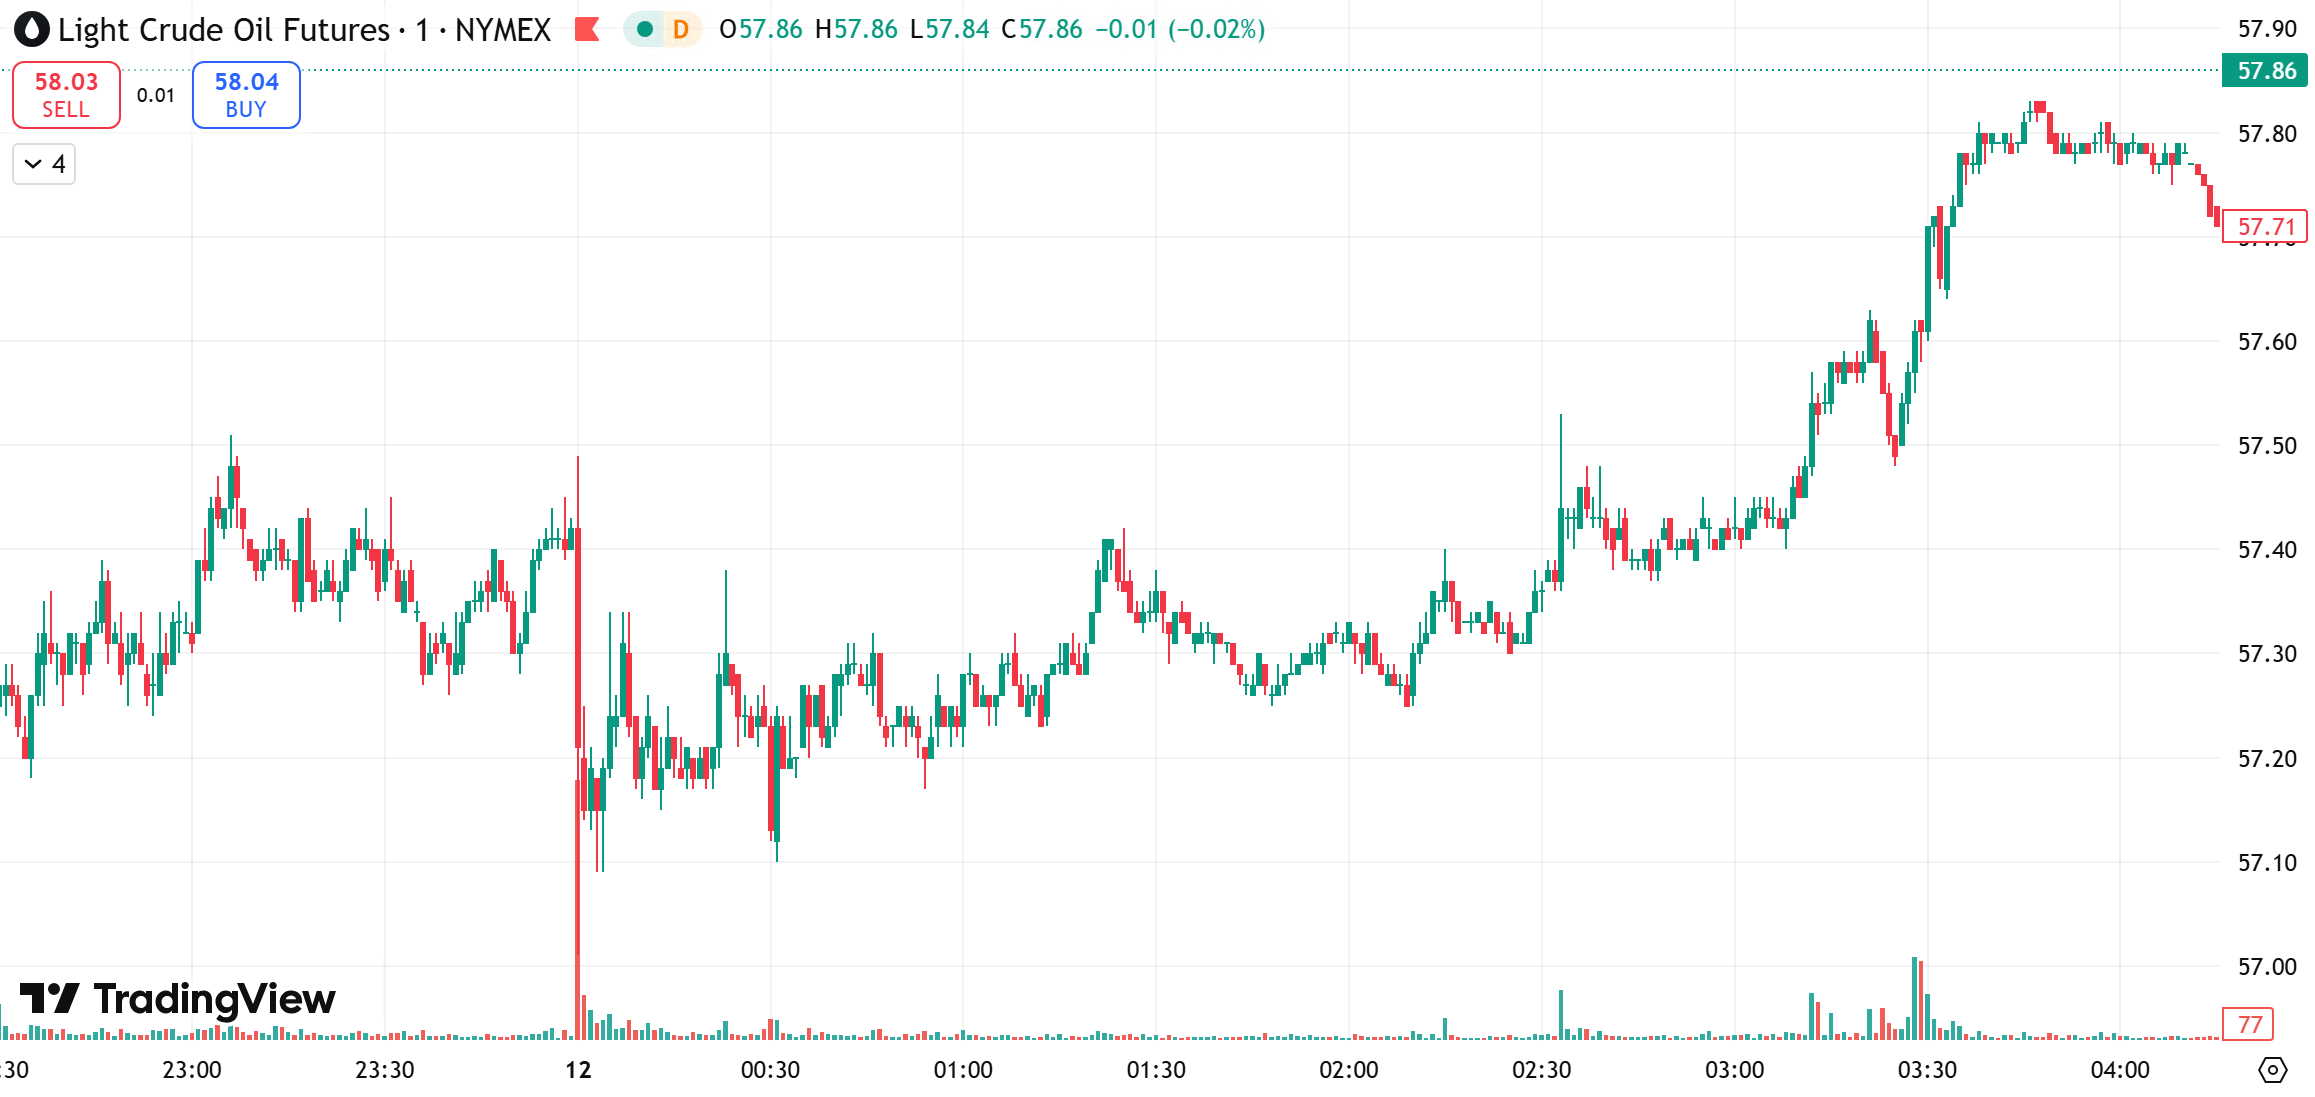
Oil remains in a secondary downtrend, repeatedly testing the 56-dollar support area. MACD shows weak bearish momentum at the daily level.
On the hourly chart, crude has resumed its downtrend and continues printing new lows. Moving averages remain in bearish alignment.
Short-term momentum suggests further downside toward the key 56-dollar support zone.
Today’s Levels
Bias: Sell the rallies; buy only deep pullbacks
• Resistance: 59.5–60.5
• Support: 57.0–56.0
Risk Disclosure
Trading Securities, Futures, CFDs and other financial products involve high risks due to the rapid and unpredictable fluctuation in the value and prices of these underlying financial instruments. This unpredictability is due to the adverse and unpredictable market movements, geopolitical events, economic data releases, and other unforeseen circumstances. You may sustain substantial losses including losses exceeding your initial investment within a short period of time.
You are strongly advised to fully understand the nature and inherent risks of trading with the respective financial instrument before engaging in any transactions with us. When you engage in transactions with us, you acknowledge that you are aware of and accept these risks. You should conduct your own research and consult with an independent qualified financial advisor or professional before making any financial, trading or investment decisions. This blog may contain speculative statements regarding future expectations, plans, or projections based on information and assumptions currently available to D Prime. Although D Prime considers these assumptions reasonable, such statements involve risks, uncertainties, and factors beyond D Prime’s control, and actual outcomes may differ significantly.
Disclaimer
This information contained in this blog is for general informational purposes only and should not be considered as financial, investment, legal, tax or any other form of professional advice, recommendation, an offer, or an invitation to buy or sell any financial instruments. The content herein, including but not limited to data, analyses and market commentary, is presented based on internal records and/or publicly available information and may be subject to change or revision at anytime without notice and it does not consider any specific recipient’s investment objectives or financial situation. Past performance references are not reliable indicators of future performance.
D Prime and its affiliates make no representations or warranties about the accuracy or completeness of this information and disclaim any and all liability for any direct, indirect, incidental, consequential, or other losses or damages arising out of or in connection with the use of or reliance on any information contained in this blog. The above information should not be used or considered as the basis for any trading decisions or as an invitation to engage in any transaction.
D Prime does not guarantee the accuracy or completeness of this report and assumes no responsibility for any losses resulting from the use of this report. Do not rely on this report to replace your independent judgment. You should conduct your own research and consult with an independent qualified financial advisor or professional before making any financial, trading or investment decisions.

