The conflict between the United States and Iran is escalating, with no clear path to de-escalation.
Iran has proven to be a difficult opponent. Not because of military strength alone, but because of something more powerful.
Its real leverage lies in the economy, the Strait of Hormuz, energy supply, and inflation.
And markets are starting to feel it.
From Soft Landing to Stagflation Risk
Just months ago, the outlook was clear.
Inflation was cooling.
The labor market was stable.
The Fed was preparing to cut rates.
A soft landing looked achievable.
That narrative is now breaking down.
Since tensions escalated in late February, energy prices have surged, pushing inflation risks back to the forefront. At the same time, US unemployment is showing early signs of rising.
This combination is dangerous.
It points toward a scenario markets fear most:
stagflation.
What Is Stagflation And Why It Matters
Stagflation is one of the most painful phases of the economic cycle.
It combines:
- high inflation
- low or slowing growth
- rising unemployment
It limits policy options and compresses asset performance.
And importantly, it is not new.
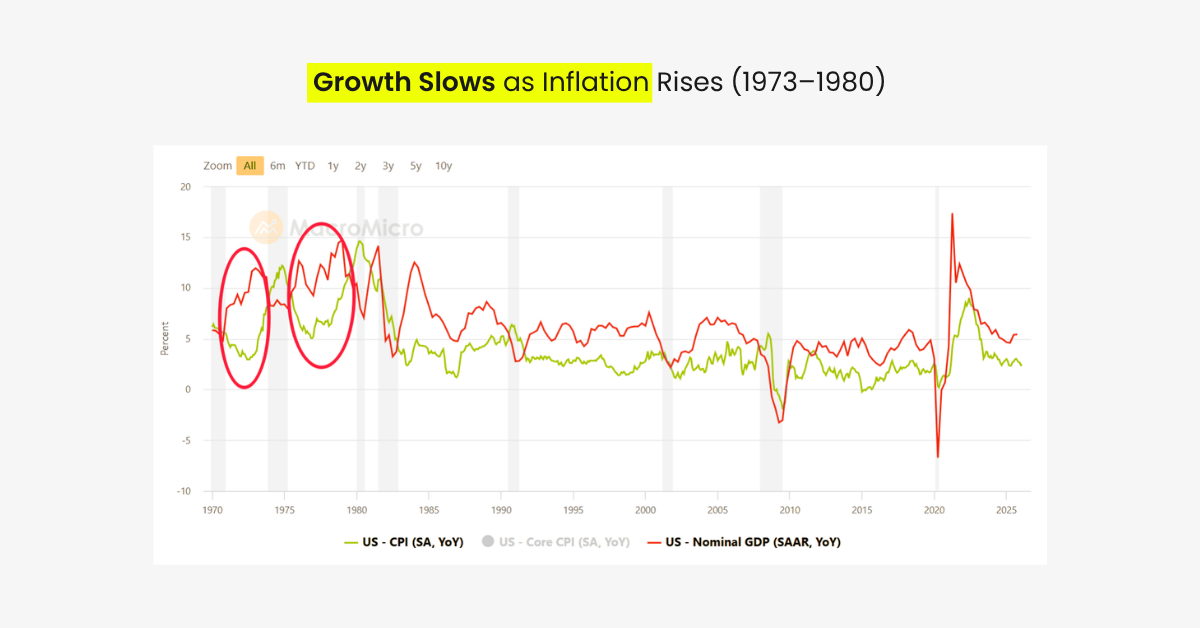
A Look Back: Lessons from the 1970s Stagflation
The United States has faced stagflation before.
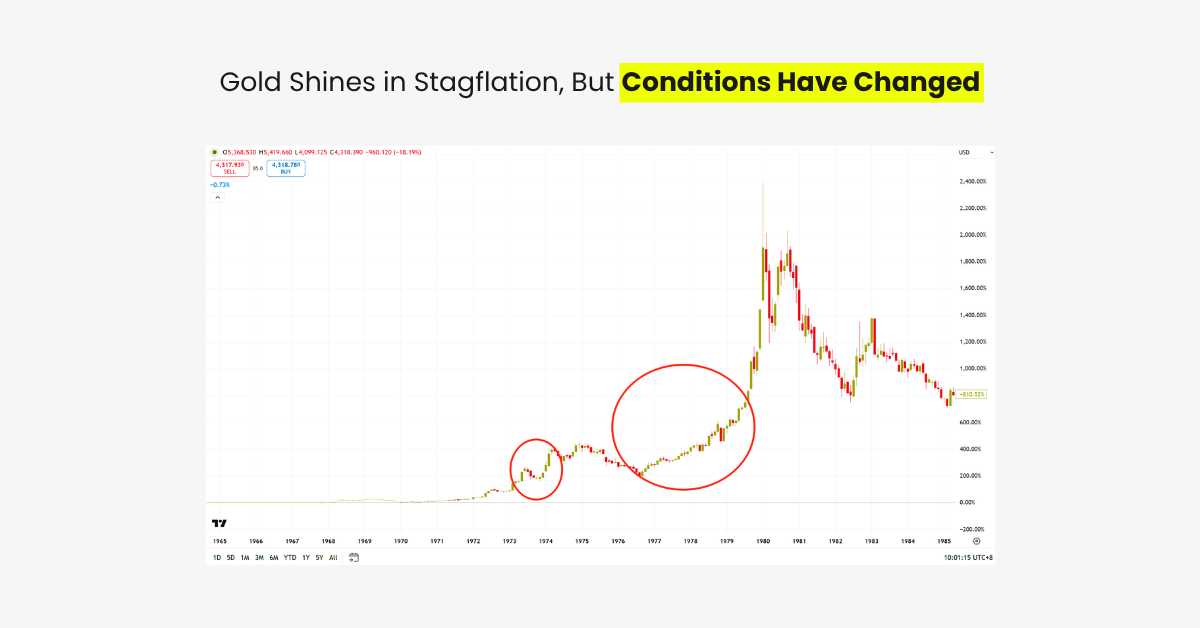
In the 1970s, two major stagflation periods reshaped the global economy:
- 1973–1974
- 1976–1980
During these periods, the relationship between growth and inflation broke down.
GDP slowed while inflation accelerated.
That divergence defines stagflation.
What Caused Stagflation in the 1970s?
Two major forces drove it.
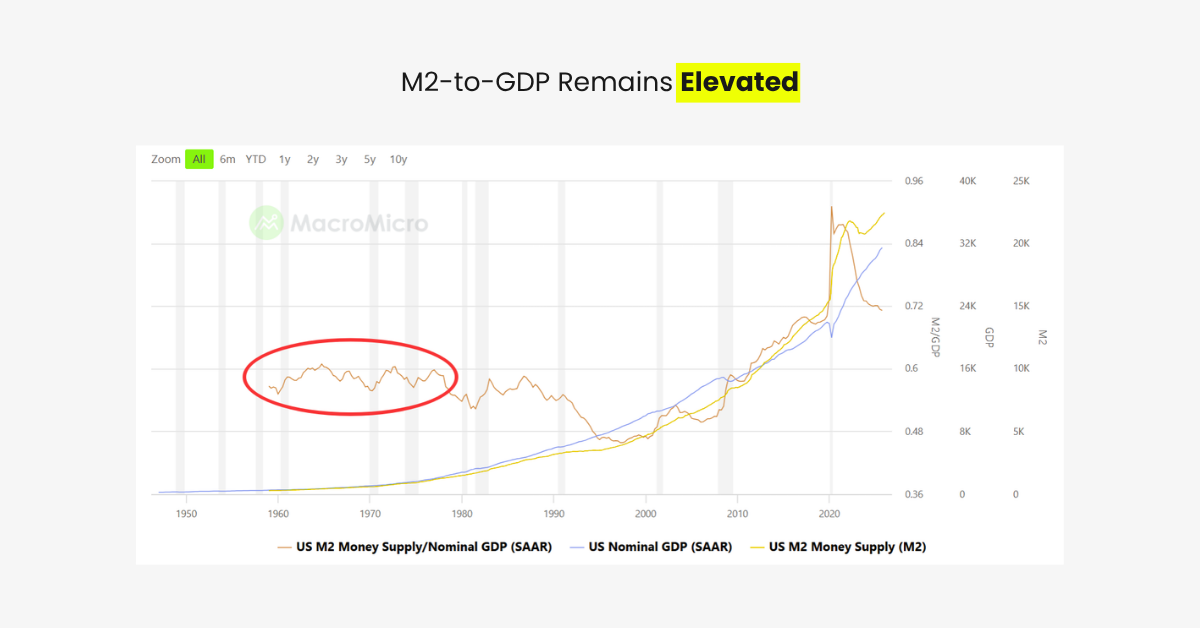
1. Excess Liquidity
Money supply expanded rapidly.
The US government ran large deficits to fund:
- social programs
- the Vietnam War
This created persistent inflation pressure.
A modern parallel is clear.
The massive liquidity injection during the 2020 pandemic continues to shape today’s inflation dynamics.
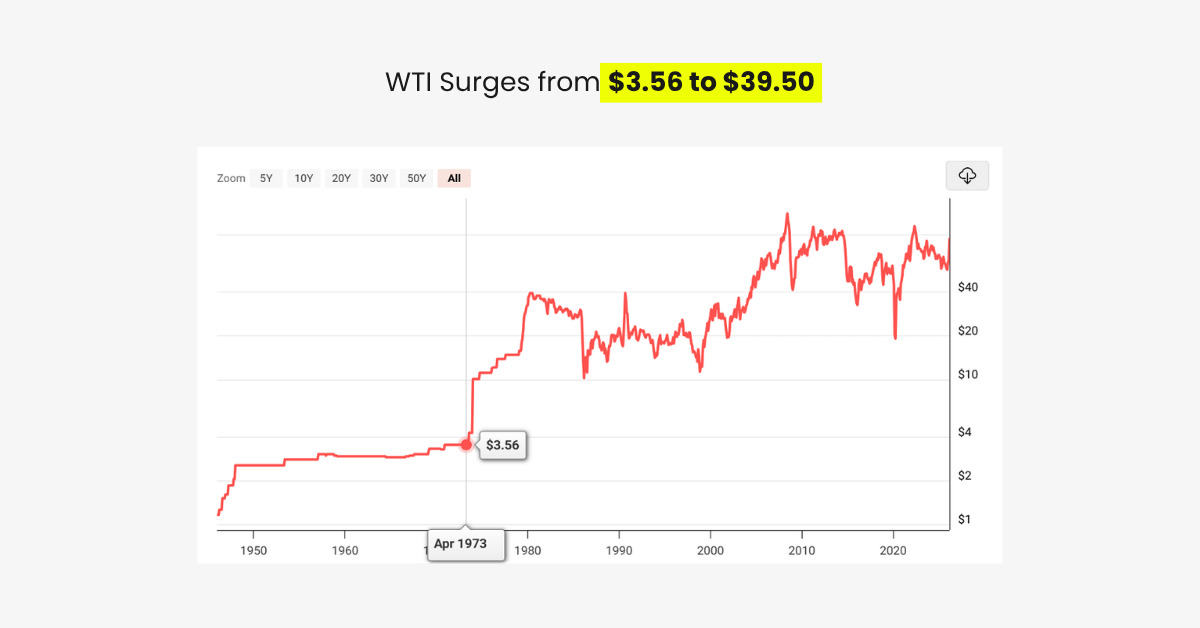
2. The Oil Shock
The 1973 Middle East war triggered a surge in energy prices.
- WTI crude rose from $3.56 to $39.50 by 1980
- More than a 10x increase
Energy was the catalyst that pushed inflation higher.
Why Today Looks Similar and Different
There are clear parallels:
- Post-pandemic excess liquidity
- Rising energy prices
- Renewed geopolitical tension
But there are also key differences.
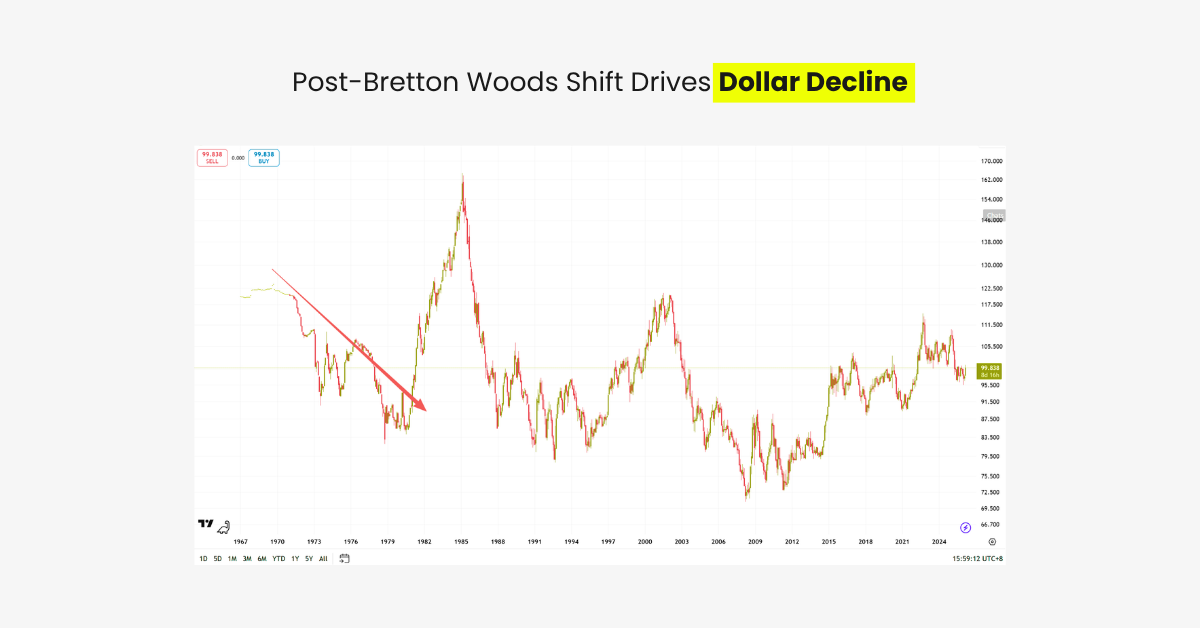
In the 1970s:
- The Bretton Woods system collapsed
- The dollar weakened
- Confidence in US assets declined
Today:
- The dollar is strengthening, not weakening
- Capital is still flowing into US assets
This changes how markets react.
Asset Performance During Stagflation
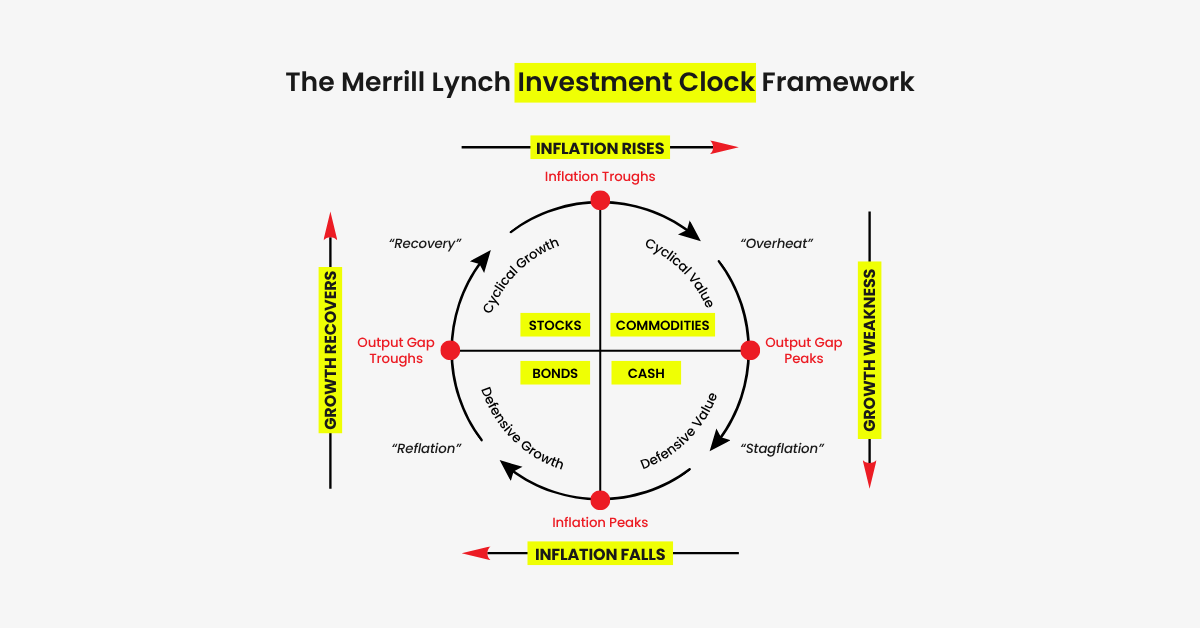
Stagflation is one of the most challenging environments for investors.
According to the Merrill Lynch Investment Clock, few assets perform well. In many cases, cash becomes the safest position.
Equities: Two Phases
In the 1970s, equities went through two distinct phases.
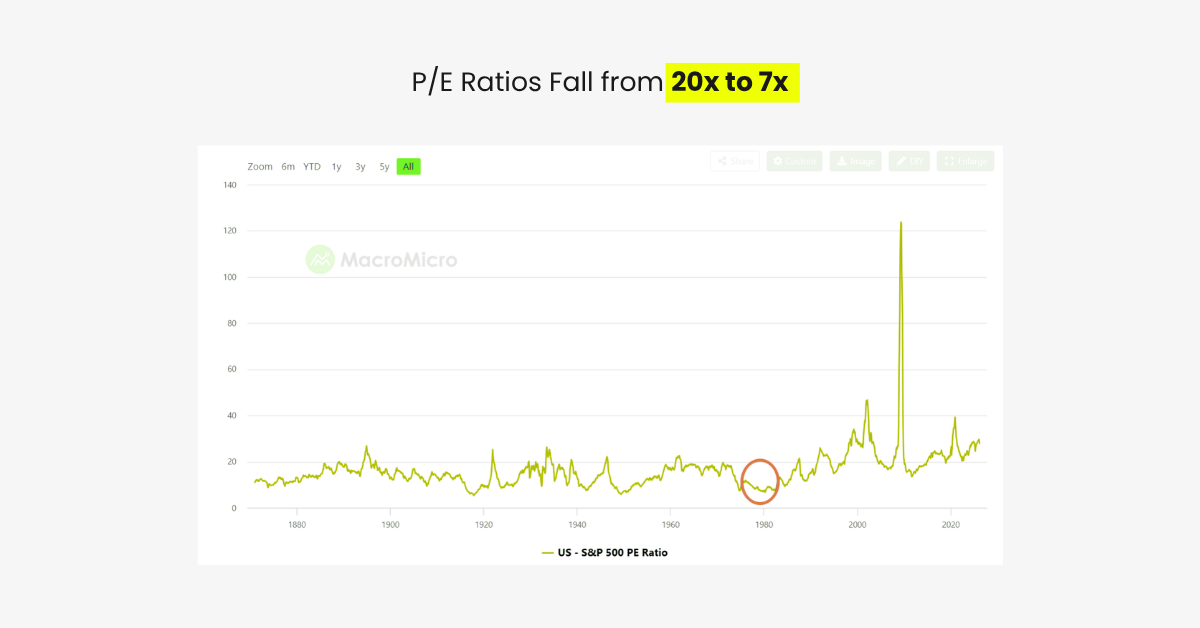
Phase 1: Valuation Collapse (1973–1974)
- S&P 500 dropped nearly 50%
- P/E ratios compressed from ~20x to below 7x
- Liquidity tightened
- Sentiment deteriorated
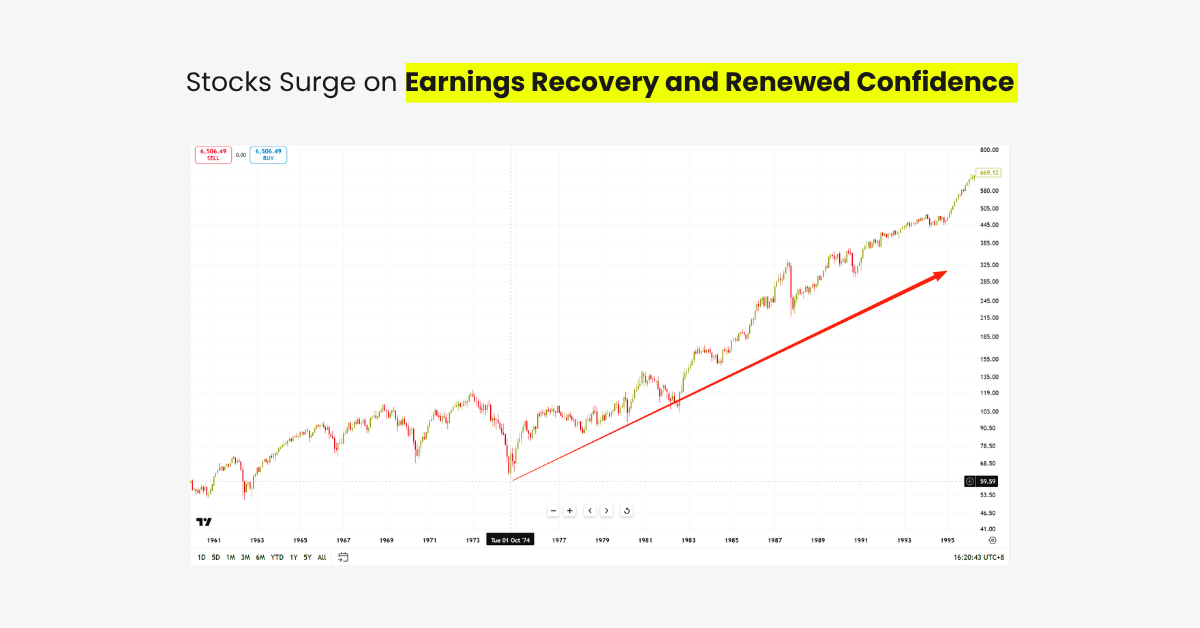
Phase 2: Recovery (1976–1980)
Once pessimism was fully priced in:
- earnings improved
- confidence returned
- equities recovered
This shows a key insight:
Markets bottom before the economy recovers.
Gold: Strong Then, Different Now
Historically, gold performs well during stagflation.
Rising inflation supports commodity prices.
But today is different.
- Higher interest rate expectations
- A stronger dollar
Both are pulling capital away from gold.
This explains why gold can fall even during inflation fears.
Lessons for Today’s Market
Stagflation is not the end of the cycle.
It is part of it.
1. Quality Still Wins
Even in stagflation:
- strong companies survive
- weak, hype-driven assets fade
Liquidity may tighten, but fundamentals still matter.
2. Energy Becomes a Leader
During the 1970s:
- energy sector weight in the S&P 500 rose from 20% to 30%
Higher oil prices directly boosted profitability.
If the current conflict persists, energy could once again outperform.
3. Consumer Spending Weakens
Inflation increases the cost of living.
As a result:
- discretionary spending declines
- consumer sectors underperform
Not all “defensive” sectors are safe.
What This Means for Markets
The market is now entering a more complex phase.
- Inflation is returning
- Growth is slowing
- Policy flexibility is shrinking
This is not a clean macro environment.
It is a transition phase.
Volatility will remain elevated.
Narratives will shift quickly.
And positioning will matter more than ever.
A New Market Reality
Stagflation does not destroy markets.
But it reshapes them.
For traders and investors, the goal is not to predict the next headline.
It is to understand how macro forces translate into asset behavior.
Because in environments like this:
The biggest risk is not volatility.
It is being positioned for the wrong cycle.
Risk Disclosure
Trading in Securities, Futures, contracts for difference (CFDs) and other financial products carries high risks due to the rapid and unpredictable fluctuation in the value and prices of these financial instruments. This unpredictability is due to the adverse and unpredictable market movements, geopolitical events, economic data releases, and other unforeseen circumstances. You may sustain substantial losses including losses exceeding your initial investment within a short period of time.
You are strongly advised to fully understand the nature and inherent risks of trading with the respective financial instrument before engaging in any transactions with us. When you engage in transactions with D Prime, you acknowledge that you are aware of and accept these risks.
Disclaimer
This article may contain speculative statements regarding future expectations, plans, or projections based on information and assumptions currently available to D Prime. Although D Prime considers these assumptions reasonable, such statements involve risks, uncertainties, and factors beyond D Prime’s control, and actual outcomes may differ significantly.
This information contained in this article is for general informational and educational purposes only and should not be considered as financial, investment, legal, tax or any other form of professional advice, recommendation, an offer, or an invitation to buy or sell any financial instruments. The content herein, including but not limited to data, analyses and market commentary, is presented based on internal records and/or publicly available information and may be subject to change or revision at anytime without notice and it does not consider any specific recipient’s investment objectives or financial situation. Past performance references are not reliable indicators of future performance. D Prime and its affiliates give no assurance that any views, projections, or forecasts will materialize.
D Prime and its affiliates make no representations or warranties about the accuracy or completeness or reliability of this information and disclaim any and all liability for any direct, indirect, incidental, consequential, or other losses or damages arising out of or in connection with the use of or reliance on any information contained in this article. The above information should not be used or considered as the basis for any trading decisions or as an invitation to engage in any transaction. Do not rely on this article to replace your independent judgment. You should conduct your own research and consult with an independent qualified financial advisor or professional before making any financial trading or investment decisions.
“D Prime” is a brand name of D Prime Vanuatu Limited, a company incorporated and regulated by the Vanuatu Financial Services Commission (Company Number: 700238). The availability of products and services may vary depending on jurisdiction and applicable regulatory requirements.