Important: This material is for general information only and does not constitute investment advice. Trading commodities and CFDs involves significant risk of loss.
Silver prices exploded in 2025. The metal has surged to new all-time highs in the mid-50s per ounce, more than doubling from the start of the year.
It is now one of the fastest-moving commodities of 2025, even outpacing gold.
Searches for “silver price forecast,” “silver outlook 2025,” and “will silver hit $100?” have spiked as traders react to the breakout.
This move is not random. Silver has smashed through a long-term range that held for decades.
With Fed rate cut expectations, rising industrial demand, and a rare 100-year silver pattern coming into focus, silver has turned into one of the most-watched markets this year.
The Fed Rate Cut Outlook: What It Means for Silver Prices
After one of the most aggressive tightening cycles in modern history, markets now expect the US Federal Reserve to move into an easing phase over the next year. Anticipation of multiple rate cuts, combined with persistent inflation and geopolitical tension, has boosted demand for precious metals in general and silver in particular.
Lower interest rates matter because they:
- reduce the opportunity cost of holding non-yielding assets like gold and silver.
- tend to weaken the US dollar, which often supports commodity prices.
- encourage investors to rotate toward assets that can benefit from renewed liquidity.
Silver has responded early. Prices are already adapting to the idea that real yields may trend lower in 2026, even if the exact timing of rate cuts is still uncertain. Analysts at several institutions now project average silver prices in the mid-50s to mid-60s range for 2026, with some more bullish forecasts pointing higher.
Some strategists even argue that if the current trend in rates, supply and investment demand continues, triple-digit silver becomes a possibility later in the decade. Those views remain speculative and sit at the optimistic end of forecasts. Yet they illustrate how strongly the macro story has turned in silver’s favor.
The 100-Year Silver Pattern: A Rare Long-Term Breakout
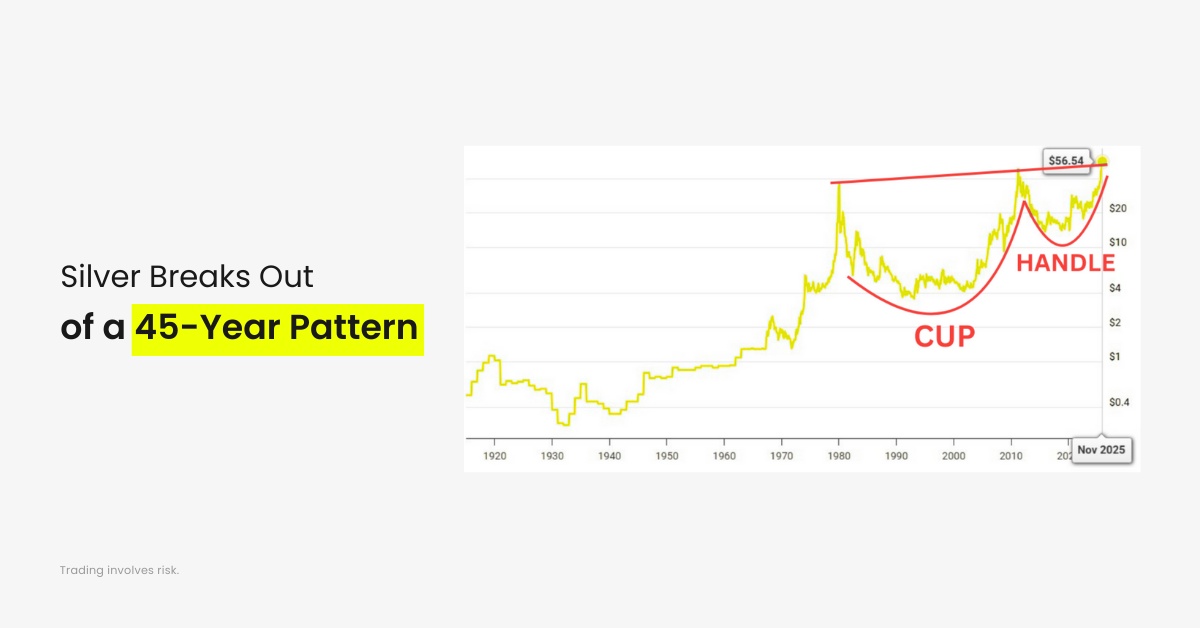
One of the most intriguing elements is the 100-year silver chart pattern.
This structure resembles a massive cup-and-handle formation that took nearly half a century to complete, and another half century building the base that brought it to this point.
Long-term chart patterns do not appear often, and when they do, traders take notice.
This setup signals a shift in long-term market structure rather than a simple short-term rally.
The breakout over previous highs confirms the pattern’s completion.
This is why many traders are revisiting long-term silver charts and comparing them to past major moves in metals.
Some analysts note that gold formed a similar structure before its explosive 2000s rally.
This historical comparison is part of what fuels the growing attention on silver’s long-term setup.
Silver’s Industrial Outlook: Why Demand Continues to Grow
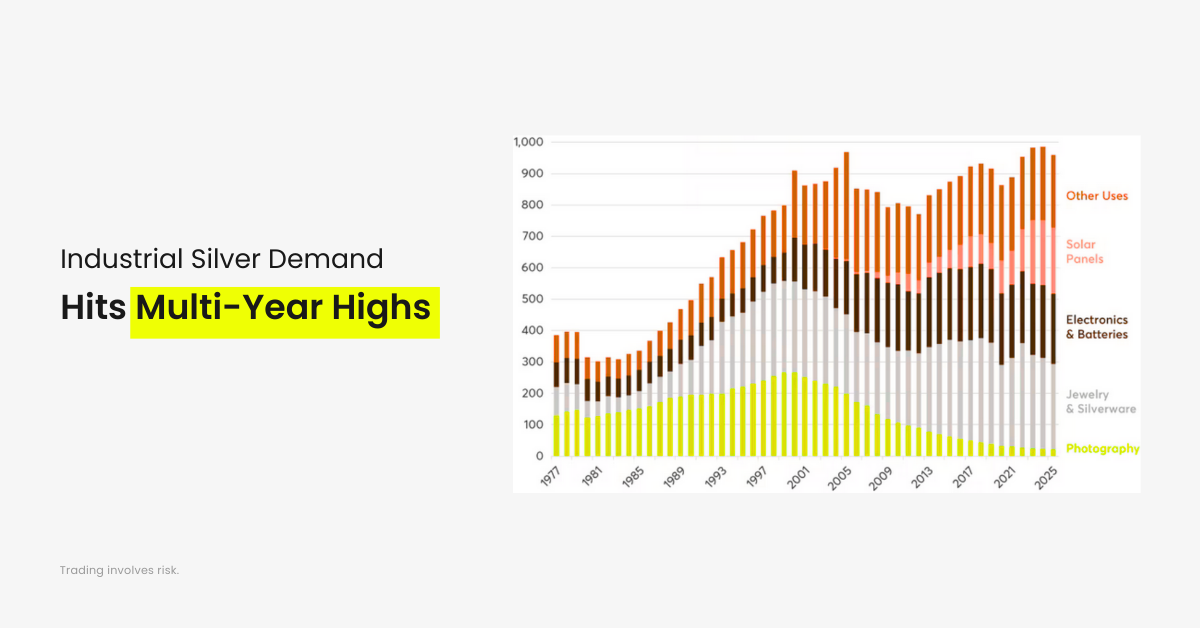
Unlike gold, silver has a deep industrial demand base.
Silver’s industrial outlook remains one of the strongest in the metals space.
Key sectors driving demand include:
- Solar (higher silver loadings improve efficiency)
- Electric vehicles
- AI hardware and data centers
- Electronics and semiconductors
- Medical and industrial applications
With green energy expansion continuing globally, solar demand alone remains a multi-year driver.
EV manufacturing and electronics growth add another layer of support.
Even if industrial demand slows in the short term, long-term adoption trends remain strong.
At the same time, silver still behaves like a monetary metal. Investors buy it as a cheaper alternative to gold when they worry about inflation, currency debasement or financial-system risk. In other words, silver has both industrial and safe-haven demand.
That dual nature is part of why silver price volatility is so high. When industrial activity and risk appetite drop at the same time, silver can sell off sharply. When both pick up together, the upside can be violent, as 2025 has just shown.
Is Silver Undervalued Compared With Gold?
Another theme that keeps showing up in research and media coverage is the gold to silver ratio. Historically, that ratio has moved around widely, but in recent years it has often hovered near or above 70, meaning it takes roughly 70 ounces of silver to buy one ounce of gold.
Many analysts argue that, given:
- The structural demand from solar, EVs and electronics
- The ongoing supply deficits and tight physical inventories
- And the strong investor interest in precious metals as “safe money”
Silver looks undervalued relative to gold at current ratios. That does not guarantee any outcome. It simply means that if gold stays strong and the ratio moves closer to historic lows, silver would need to rise faster than gold.
The $100 Silver Debate
Right now, the question “Will silver reach $100?” is everywhere. It features in bank research, interviews and countless price-forecast pieces.
Here is the reality:
- Many mainstream forecasts cluster in the 55 to 70 range for the next couple of years.
- Some more aggressive models and media outlets outline scenarios where silver could eventually trade near or above 100, often tied to continued supply deficits, strong industrial demand and further rate cuts.
For traders and investors, the key point is not to treat any single number as destiny. Instead, the $100 level functions as a psychological reference point that signals how intense the current bullish narrative has become around silver.
From a market-structure standpoint, what matters more is whether:
- The breakout above prior all-time highs holds on pullbacks
- Physical tightness in key hubs such as London and New York persists
- The Fed actually delivers the easing path that futures are pricing in
Those are the variables that will decide whether current silver price forecasts prove conservative or optimistic.
Silver Forecast 2025: The Key Signals to Watch Next
Several catalysts will influence the next phase of silver’s trend:
1. Fed rate cut decisions
Any shift in timing or magnitude can immediately influence silver prices.
2. US dollar weakness
A weaker dollar tends to support silver and other commodities.
3. Industrial demand data
Solar, EVs, electronics, and clean energy remain the most important sectors.
4. Supply and inventory levels
Physical tightness in key storage hubs remains an ongoing theme.
5. The gold-to-silver ratio
A sustained decline in the ratio would indicate stronger relative demand for silver.
6. Market sentiment and safe-haven flows
Geopolitical stress and macro uncertainty tend to increase precious-metal interest.
Silver’s 2025 breakout sits at the crossroads of these forces. The 100-year price chart shows how unusual the current move is, while the fabrication demand chart explains why the metal has more than one engine behind it.
Whether or not the market ever reaches the triple-digit levels that some strategists discuss, the combination of monetary and industrial demand means silver is likely to stay at the center of conversations around safe-haven assets, green-energy materials and precious-metal diversification for some time.
Risk Disclosure
Trading Securities, Futures, CFDs and other financial products involve high risks due to the rapid and unpredictable fluctuation in the value and prices of these underlying financial instruments. This unpredictability is due to the adverse and unpredictable market movements, geopolitical events, economic data releases, and other unforeseen circumstances. You may sustain substantial losses including losses exceeding your initial investment within a short period of time.
You are strongly advised to fully understand the nature and inherent risks of trading with the respective financial instrument before engaging in any transactions with us. When you engage in transactions with us, you acknowledge that you are aware of and accept these risks. You should conduct your own research and consult with an independent qualified financial advisor or professional before making any financial, trading or investment decisions. This blog may contain speculative statements regarding future expectations, plans, or projections based on information and assumptions currently available to D Prime. Although D Prime considers these assumptions reasonable, such statements involve risks, uncertainties, and factors beyond D Prime’s control, and actual outcomes may differ significantly.
Disclaimer
This information contained in this blog is for general informational purposes only and should not be considered as financial, investment, legal, tax or any other form of professional advice, recommendation, an offer, or an invitation to buy or sell any financial instruments. The content herein, including but not limited to data, analyses and market commentary, is presented based on internal records and/or publicly available information and may be subject to change or revision at anytime without notice and it does not consider any specific recipient’s investment objectives or financial situation. Past performance references are not reliable indicators of future performance.
D Prime and its affiliates make no representations or warranties about the accuracy or completeness of this information and disclaim any and all liability for any direct, indirect, incidental, consequential, or other losses or damages arising out of or in connection with the use of or reliance on any information contained in this blog. The above information should not be used or considered as the basis for any trading decisions or as an invitation to engage in any transaction.
D Prime does not guarantee the accuracy or completeness of this report and assumes no responsibility for any losses resulting from the use of this report. Do not rely on this report to replace your independent judgment. You should conduct your own research and consult with an independent qualified financial advisor or professional before making any financial, trading or investment decisions.


