


US CPI met expectations, yet Fed still raised rates. See how core CPI, PPI, oil and Treasury yields changed the inflation ans rate outlook.
US CPI Holds at 3.4%: Why Did the Fed Still Hike
US inflation came in almost exactly where markets expected. The Fed still hiked.
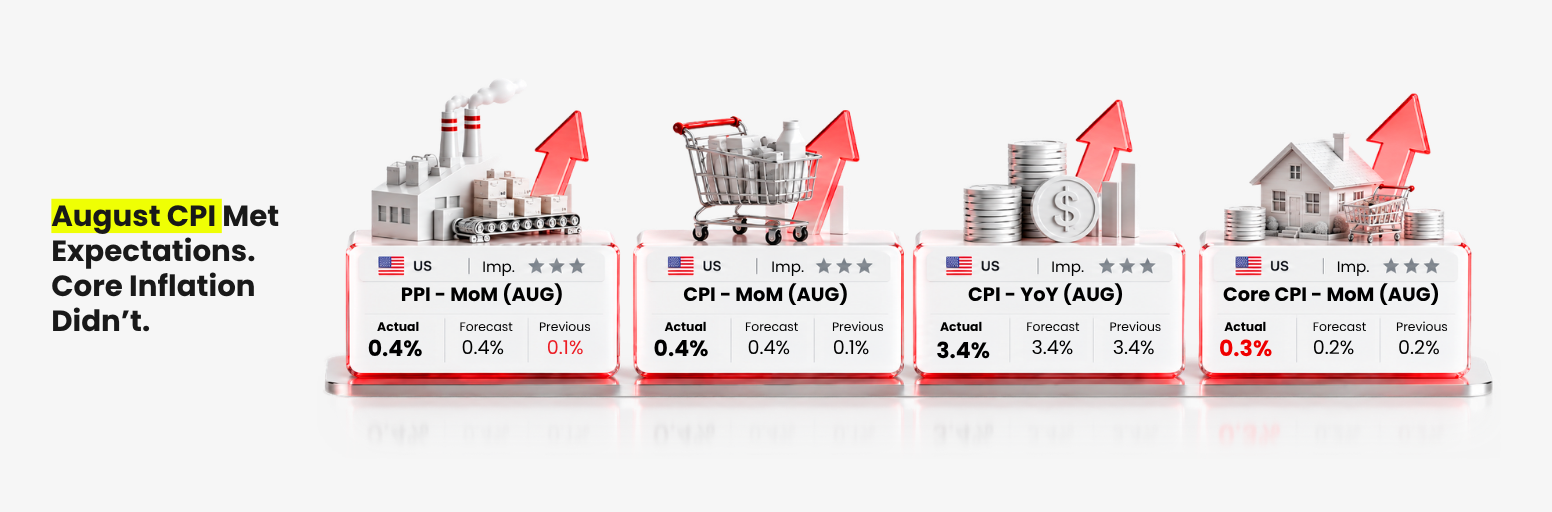
According to the US Bureau of Labor Statistics’ August CPI report, headline CPI held at 3.4% year over year, while core CPI eased to 2.4%, its lowest annual reading since March 2021.
On paper, that hardly looked like the kind of inflation report that should push the Fed back into tightening mode.
But markets focused on something else.
Hotter PPI first pushed expectations for a September hike sharply higher. CPI then drove those odds close to 90%.
And on September 16, the market got exactly what it had been pricing: the Federal Reserve raised rates by 25 basis points to 3.75%–4.00%, its first increase since 2023.
So what did markets and the Fed see behind these seemingly mild inflation numbers?
The answer lies beneath the annual figures: upstream energy costs are rising sharply, monthly core inflation accelerated to 0.3%, and the risk of sticky inflation has become harder to ignore.
The September hike is now behind us.
The bigger question is whether it stops there.
This week’s Market Dive looks at what PPI and CPI were really telling us, why the Fed returned to rate hikes, and what the new tightening outlook means for Treasury yields, gold and the next major market move.
US PPI Shows Inflation Pressure Building Upstream
The first warning came from August PPI.
The BLS Producer Price Index report showed headline PPI rising 0.4% month over month and 5.4% year over year, accelerating sharply from July.
The pressure was concentrated in goods.
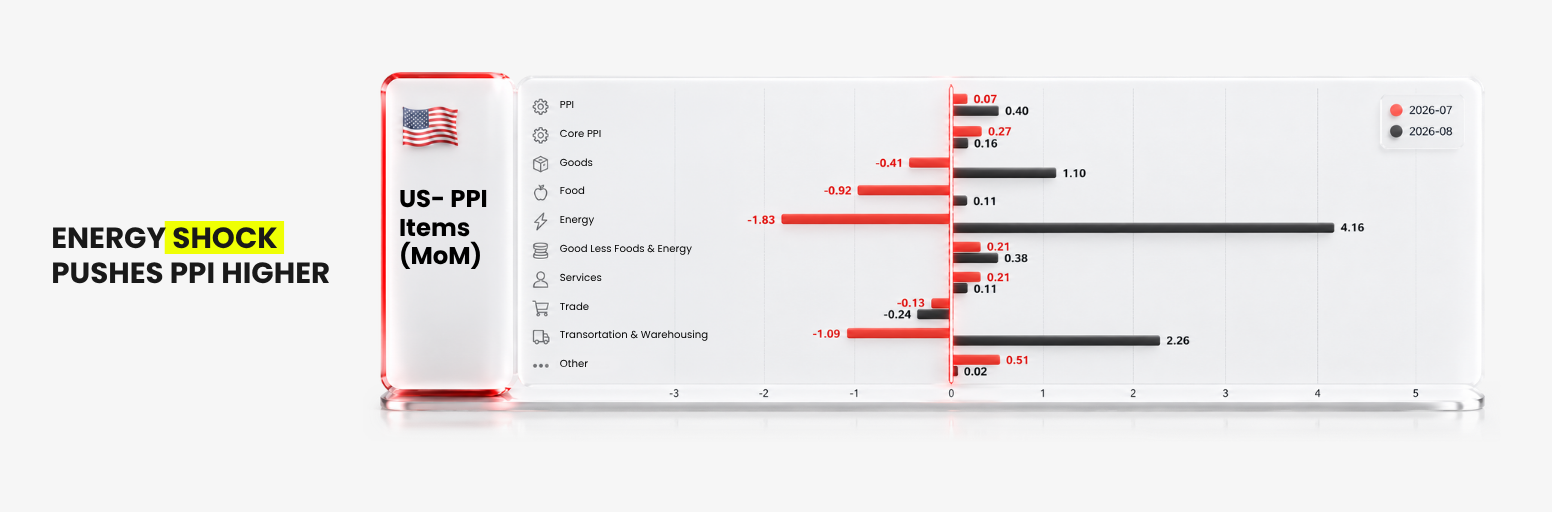
Final-demand goods prices increased 1.1% month over month, while energy prices jumped around 4.2%. Diesel prices alone surged 24.1%.
Services told a different story, rising only 0.1% during the month.
The contrast is important.
Upstream inflation is currently running hotter than downstream inflation.
The same pattern appeared further up the supply chain. Prices at the earliest stage of intermediate demand rose 1.4% month over month and 11.3% year over year.
That does not mean higher producer prices will automatically translate into equally strong consumer inflation.
Companies can absorb some higher costs through margins, and pass-through into consumer prices can take time.
But it raises the risk that higher energy, transportation and production costs eventually work their way through the economy.
That is what markets reacted to.
The issue was not simply that PPI reached 5.4%. It was that another energy-driven inflation shock appeared to be building upstream just as the Fed was deciding whether inflation had cooled enough to keep rates unchanged.
US CPI Was Mild on the Surface, But Monthly Inflation Picked Up
The following day, August US CPI added another layer to the story.
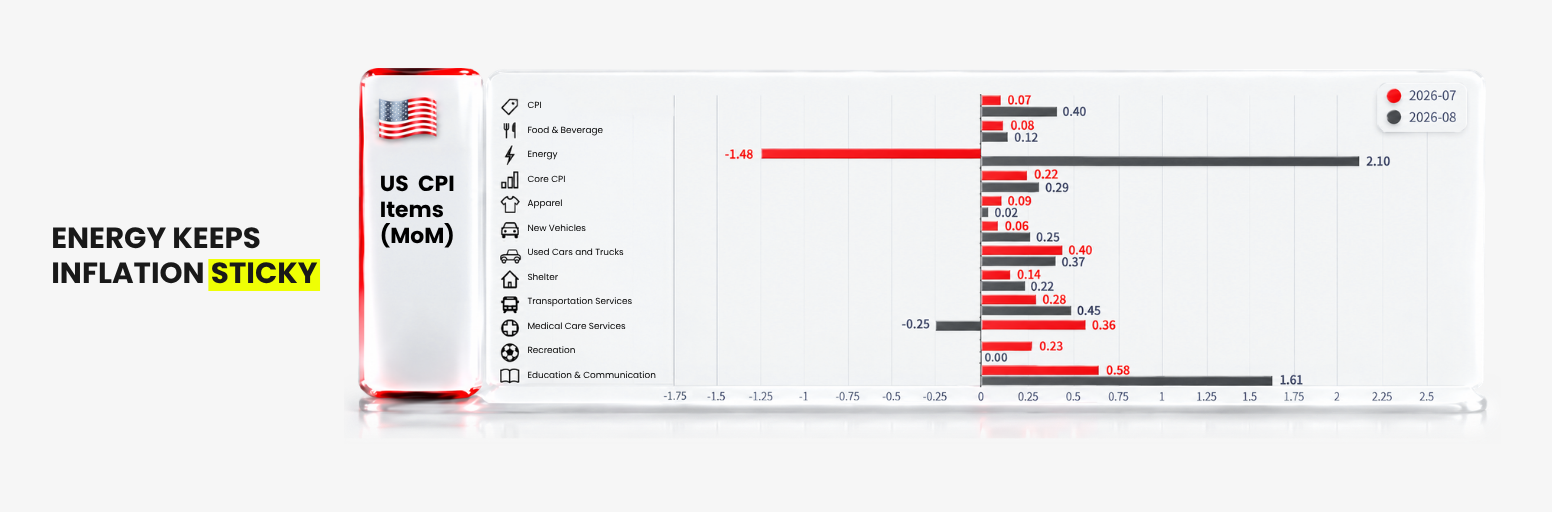
Headline CPI increased 0.4% month over month, up sharply from 0.1% in July. Core CPI rose 0.3%, while its annual rate eased to 2.4%.
Energy remained one of the biggest drivers.
According to the BLS detailed CPI data, the energy index rose 2.1% in August, while gasoline increased 3.9% and accounted for more than one-third of the monthly headline CPI increase.
Several service categories also rebounded.
Lodging away from home increased after falling sharply in July, while airfares and communication prices also moved higher.
But inflation was not worsening everywhere.
Motor vehicle insurance declined 0.8%, apparel prices were unchanged and recreation was flat. Shelter inflation also remained much calmer than during the earlier stages of the inflation cycle.
So August CPI was not a story of inflation suddenly returning across the entire economy.
Instead, energy and several volatile service categories pushed monthly inflation higher while other important components continued to moderate.
That explains the apparent contradiction.
The annual core CPI rate of 2.4% looks relatively reassuring.
The monthly core CPI reading of 0.3% looked much less comfortable.
Why Did 0.3% Core CPI Matter So Much?
Going into the US CPI release, markets were increasingly focused on whether monthly core inflation would come in at 0.2% or 0.3%.
A softer reading would have strengthened the case for the Fed to wait.
Instead, core CPI landed at 0.3%.
That small difference mattered because the Fed entered September facing two competing signals.
The labor market remains relatively resilient. August payrolls increased by 162,000, unemployment held at 4.1%, and previous months were revised higher.
But inflation remains above target, producer-price pressure is increasing and energy costs have become a much bigger risk.
The CPI report therefore gave the hawkish side of the debate more support.
And markets ultimately read the Fed correctly. On September 16, policymakers raised the federal funds target range by 25 basis points to 3.75%–4.00%. In its official FOMC statement, the Fed said inflation remained elevated and that the move would support a more timely return toward its 2% objective.
The lesson is important.
Markets, and now the Fed are not looking only at the year-over-year inflation number.
Near-term inflation momentum matters.
A 2.4% annual core CPI rate suggests that the broader disinflation trend is still intact.
But a 0.3% monthly core reading, arriving alongside another energy shock, makes it much harder for the Fed to dismiss short-term inflation risks.
The Hiked Was Priced. The Path Wasn’t
By the time the Fed announced its decision, the 25-basis-point hike was already heavily anticipated.
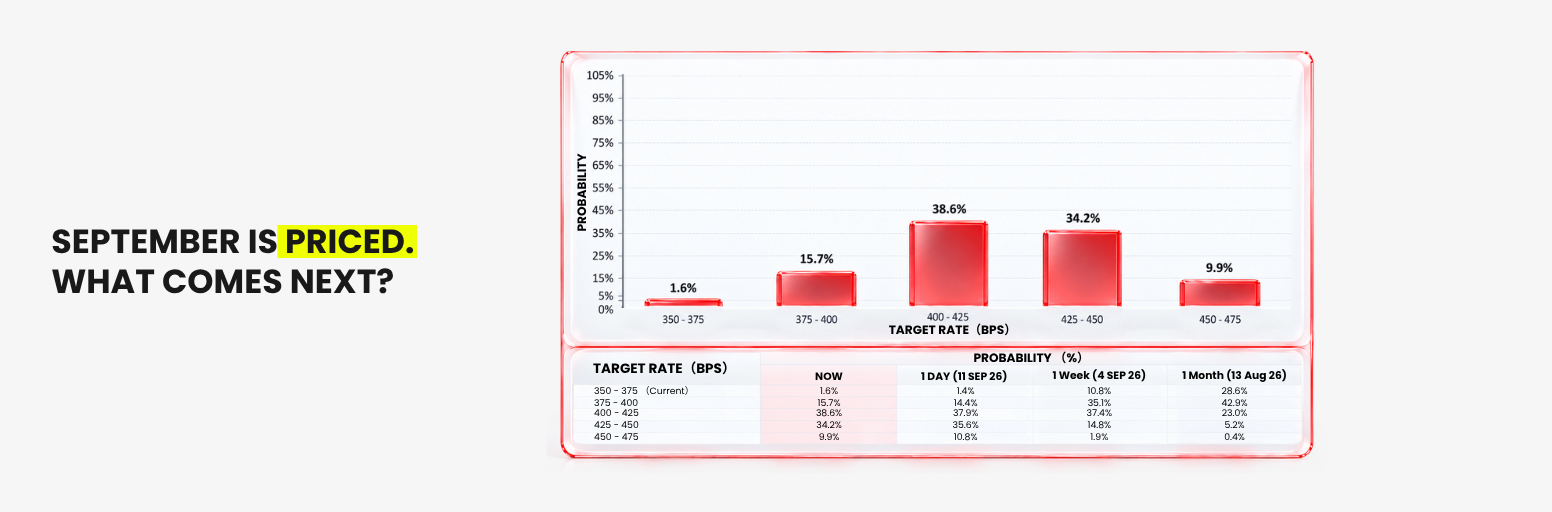
That helps explain why the move itself did not trigger a lasting selloff across markets.
US equities initially came under pressure as Treasury yields moved higher, but recovered in the following session as yields and oil eased.
Gold showed a similar pattern, testing the USD 4,300 area before recovering.
The takeaway is not that rate hikes suddenly became bullish.
It is that an expected hike has much less power to surprise markets than an unexpected change in the future rate path.
The September decision is done.
What matters now is whether it was an isolated adjustment or the beginning of a longer tightening phase.
One Hike Is Done. How Many More Could Follow?
The Fed’s latest projections suggest policymakers may not be finished.
The September Summary of Economic Projections raised the median projected federal funds rate for the end of 2026 to 4.1%, up from 3.8% in June.
With the current target range at 3.75%–4.00%, that path is consistent with roughly one additional 25-basis-point increase by year-end.
The debate has therefore changed.
Before September, markets were asking:
Will the Fed hike?
Now they are asking:
How far will the Fed go?
The same projections put 2026 headline PCE inflation at 3.7% and core PCE at 3.4%, suggesting policymakers remain concerned that inflation could stay above target longer than previously expected.
At the same time, the US economy is not uniformly strong.
The Fed still has to balance persistent inflation against the risk that too much tightening creates a sharper slowdown.
The Bigger Risk Now May Be Treasury Yields
With the September decision behind us, traders should increasingly focus on the bond market.
According to the US Treasury’s official daily yield curve data, the 10-year Treasury yield reached 5.01% on September 16, while the 30-year stood at 5.35%.
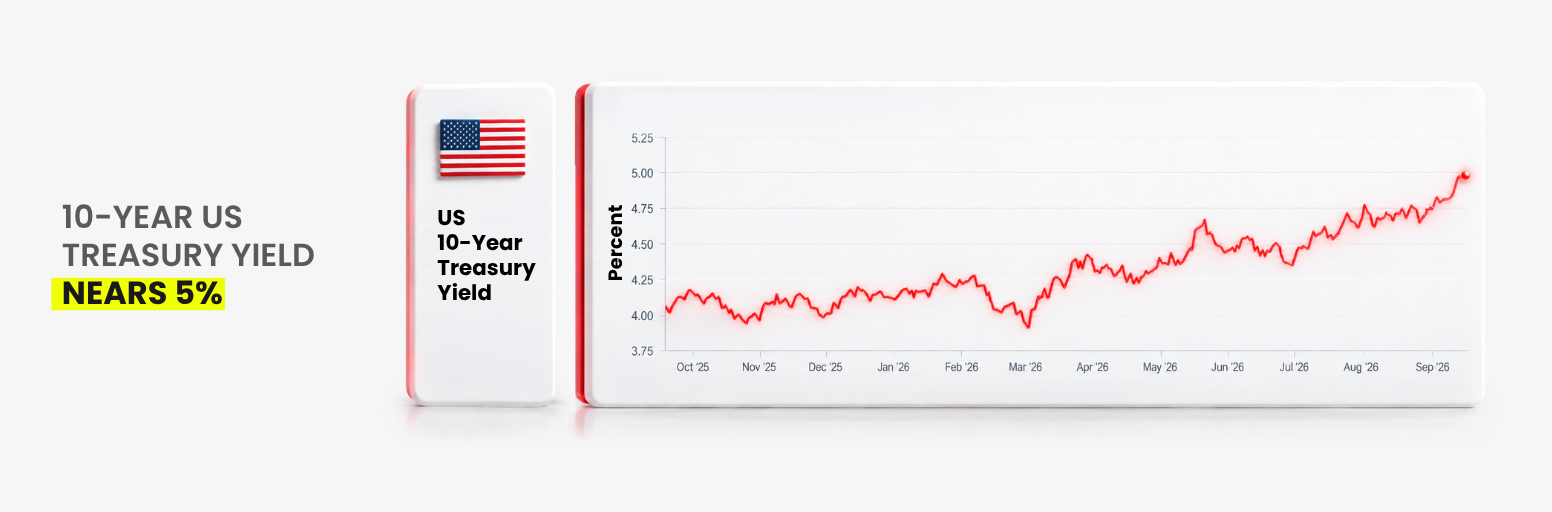
Those levels matter.
With the September decision behind us, traders should increasingly focus on the bond market.
According to the US Treasury’s official daily yield curve data, the 10-year Treasury yield reached 5.01% on September 16, while the 30-year stood at 5.35%.
A Fed hike directly affects short-term rates.
But long-term Treasury yields influence borrowing costs throughout the financial system.
Higher yields raise mortgage rates, increase corporate refinancing costs and lift the discount rate applied to future earnings.
That is particularly important for long-duration growth stocks.
So even if markets absorbed the September hike, a sustained 10-year yield around or above 5% could create much greater pressure.
The bond market may now matter more than the hike itself.
Oil Remains the Biggest Inflation Wild Card
Energy was already one of the main drivers of August PPI and CPI.
Oil prices have since moved even higher.
The US Energy Information Administration’s official Brent crude data showed Brent reaching USD 130.80 per barrel on September 15, after trading below USD 90 in late August.
Prices have since eased, but the scale of the move shows how quickly the inflation outlook can change.
If oil remains above USD 100 for an extended period, the risk is that higher energy costs begin spreading more broadly through transportation, production and inflation expectations.
That presents a difficult problem for monetary policy.
The Fed can cool demand.
It cannot create more oil.
This is why energy prices may ultimately matter more for the inflation outlook than one isolated CPI reading.
What Do US CPI and Fed Policy Mean for Gold?
Gold now sits between two clear forces.
Higher Treasury yields and the possibility of further Fed tightening increase the opportunity cost of holding a non-yielding asset.
But geopolitical risk, fiscal uncertainty and structural central-bank demand continue to provide support.
The World Gold Council’s latest central-bank data showed central banks purchasing a net 23 tonnes of gold in July, taking reported year-to-date purchases to around 130 tonnes.
For traders, the more useful signal may therefore be the relationship between gold and Treasury yields.
If yields continue rising as markets price a longer tightening cycle, gold could remain under pressure.
If yields stabilize while geopolitical and fiscal uncertainty remain elevated, safe-haven demand could regain the upper hand.
What Should Traders Watch After the US CPI Report?
The September hike is done. The focus now shifts to what follows.
Watch the Fed’s guidance. Updated projections point to the possibility of another hike this year. The key question is how strongly policymakers reinforce that path.
Watch the 10-year Treasury yield around 5%. A sustained move above that level could create greater pressure on equities and other long-duration assets.
Watch oil. Persistent high energy prices remain one of the biggest supply-side risks to the US inflation outlook.
Watch gold’s reaction to Treasury yields. If gold remains resilient despite higher rates, underlying safe-haven demand may be stronger than the traditional rates relationship suggests.
Watch the yen and the BOJ. The Bank of Japan’s official schedule confirms its next monetary policy meeting for September 17–18. Rising Japanese rates or a stronger yen could pressure yen-funded carry trades and create another source of tighter global liquidity.
August US inflation was not out of control.
Headline CPI matched expectations. Annual core CPI continued to slow. Shelter and several other components are still cooling.
But that was not what markets focused on.
They saw 0.3% monthly core CPI, rising upstream costs and an energy shock that could keep inflation sticky for longer.
That was enough to bring rate hikes back.
The bigger uncertainty is what comes next.
But how much further it needs to go and whether bond yields can absorb it without putting greater pressure on growth and markets.
By D Prime Analysis Team
Macro and market strategy research by D Prime’s in-house analysis team.
Disclaimer
The information contained herein is provided for general informational and educational purposes only and does not constitute investment advice, financial advice, trading advice or any other form of professional advice, a recommendation, or an offer or solicitation to buy or sell any financial instruments or engage in any trading strategy.
Trading in leveraged products such as contracts for difference (CFDs) involves a significant risk of loss and may not be suitable for all investors. Past performance is not indicative of future results. Any references to market trends, asset performance, price levels, or forward-looking statements reflect opinions or general market commentary as at the date of publication and are subject to change without notice.
This article does not take into account any individual investor’s objectives, financial situation, or risk tolerance. Readers should conduct their own independent research and seek professional advice before making any investment or trading decisions. D Prime and its affiliates make no representations or warranties about the accuracy or completeness or reliability of this information and disclaim any and all liability for any direct, indirect, incidental, consequential, or other losses or damages arising out of or in connection with the use of or reliance on any information contained herein. The above information should not be used or considered as the basis for any trading decisions or as an invitation to engage in any transaction. Do not rely on this article to replace your independent judgment.
“D Prime” is a brand name of D Prime Vanuatu Limited, a company incorporated and regulated by the Vanuatu Financial Services Commission (Company Number: 700238). The availability of products and services may vary depending on jurisdiction and applicable regulatory requirements.