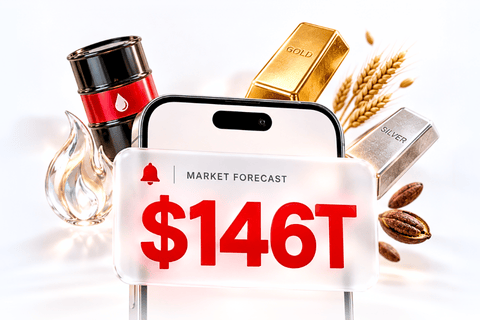


According to the latest commodity forecast from Statista Market Insights, the global commodity market is expected to reach a staggering notional value of $146.64 trillion in 2026, up from $144.05 trillion the previous year.
This sustained growth is a strong signal for the broader financial markets, highlighting the immense, underlying liquidity present in global commodities.
However, looking at the macro figure is only the first step.
For active traders, the real question shaping the 2026 commodity market outlook is: which specific sectors are absorbing this capital flow? Why are they attracting this volume, what fundamental drivers are moving their prices, and which instruments should investors be watching right now?
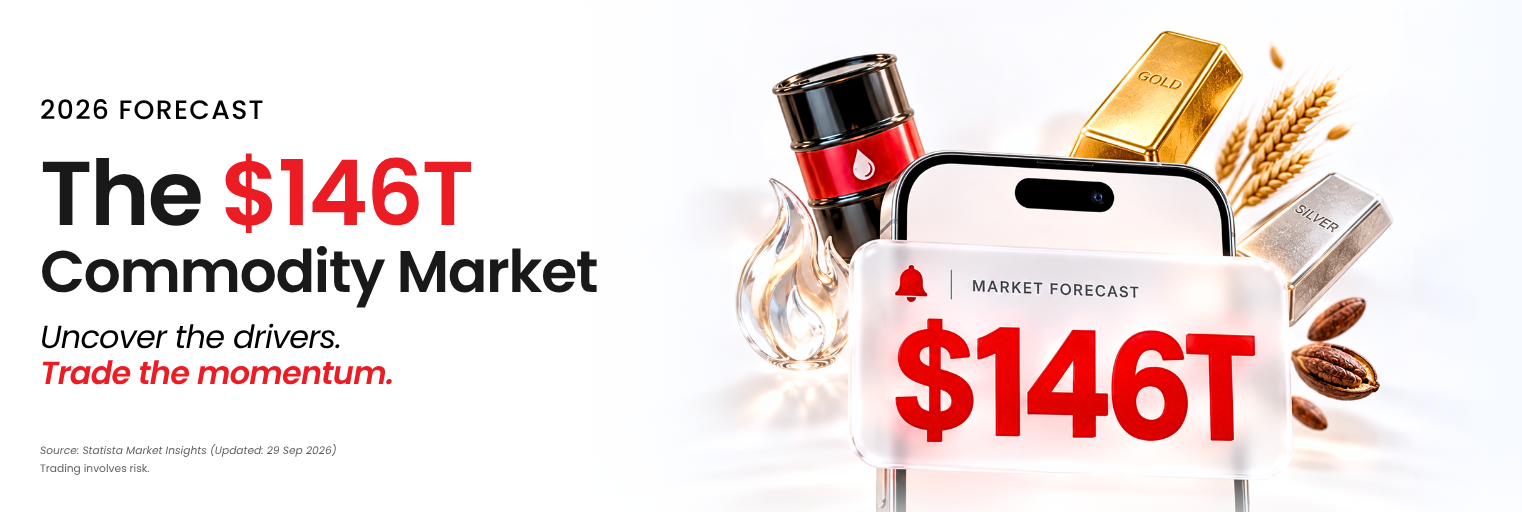
In this article, we break down the four dominant sectors of the 2026 commodity market. By identifying where the deepest liquidity lies within this commodity forecast, we aim to help you uncover where you can find your next trading opportunity.
The Notional Value of Commodity Sectors at a Glance
Understanding where liquidity sits is essential for identifying clear, tradeable market pathways in the 2026 commodity market outlook.
In 2026, the total projected notional value stands at $146.64 trillion. When compared to the $144.06 trillion recorded in 2025, we see steady capital growth across all major sectors, indicating sustained institutional participation.
| 2025 (trillion USD) | 2026 forecast (trillion USD) | |
| Energy Products | 49.98 | 51.16 ⬆️ |
| Agricultural Products | 36.89 | 37.46 ⬆️ |
| Precious Metals | 35.49 | 36.11 ⬆️ |
| Industrial Metals | 21.67 | 21.88 ⬆️ |
| Others | 0.02 | 0.02 |
| Total | 144.06 | 146.64 |
This immense capital is distributed across four primary pillars: Energy Products at $51.16 trillion (34.89%), Agricultural Products at $37.46 trillion (25.55%), Precious Metals at $36.11 trillion (24.63%), and Industrial Metals at $21.88 trillion (14.92%).
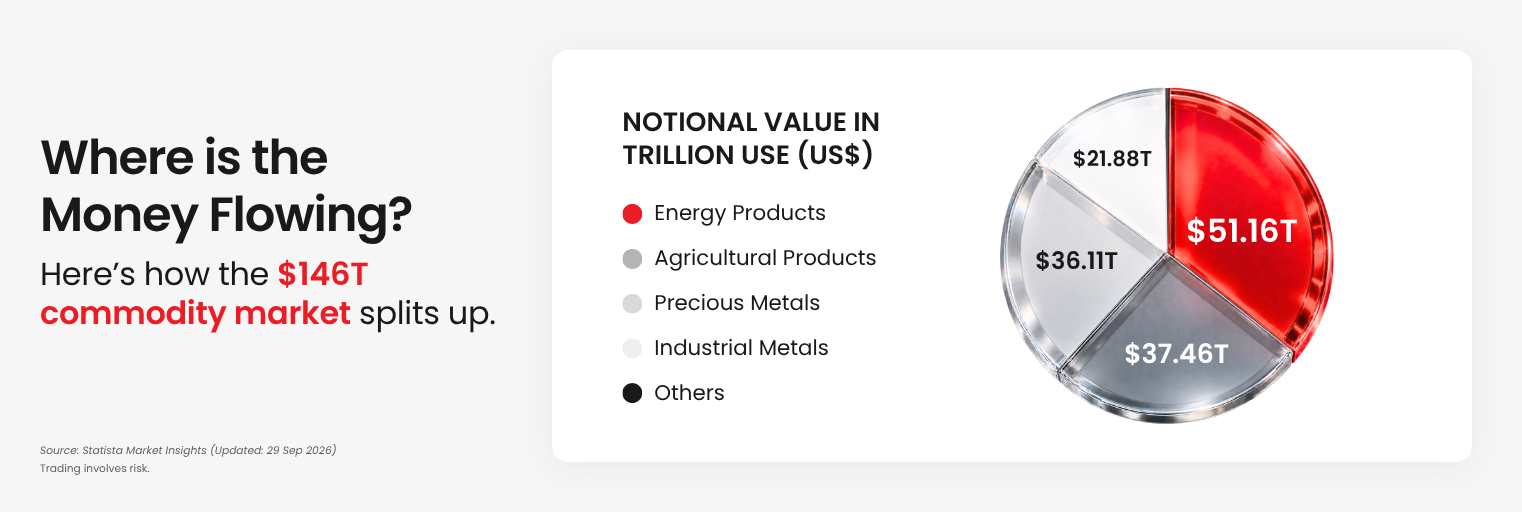
While energy products predictably dominate overall commodity trading, it is notable that Agricultural Products and Precious Metals are commanding nearly identical capital inflows, securing the second and third ranks respectively in this commodity forecast.
2026 Commodity Derivatives at a Glance
For investors analyzing the 2026 commodity market outlook, the real value lies in understanding exactly what is drawing capital into the most traded commodities across these four sectors. Once you understand the forces driving the price action and which specific instruments to watch, you get a much clearer map of where to trade next.
Energy Products: The Largest Share of the Market
- Projected Notional Value: $51.16 Trillion | 34.89%
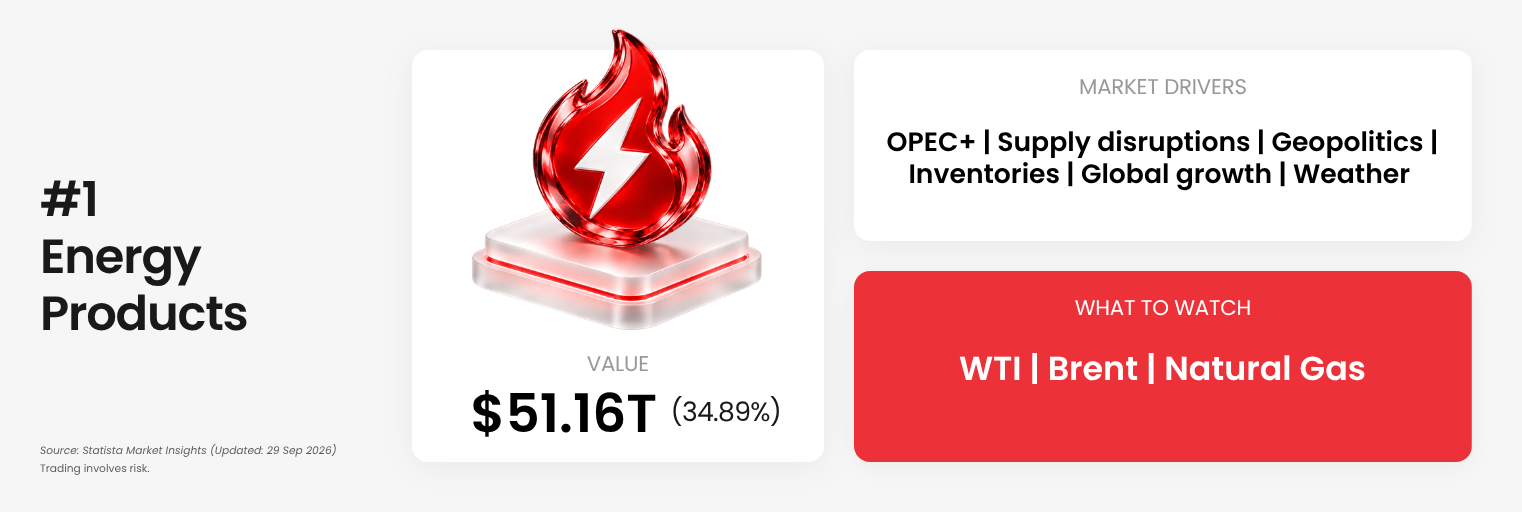
Energy leads the four sectors covered here, and it is easy to see why crude oil and natural gas remain so closely watched. These markets sit directly at the intersection of economic activity, geopolitics and global supply.
A surprise OPEC+ decision, an escalation around a major supply route, or a shift in demand expectations can quickly change the outlook for crude oil and related assets.
What Moves Energy
OPEC+ • Supply disruptions • Geopolitics • Inventories • Global growth • Weather
Markets to Watch
WTI • Brent • Natural Gas
Agriculture: Where Weather Becomes a Market Catalyst
- Projected Notional Value: $37.46 Trillion | 25.55%
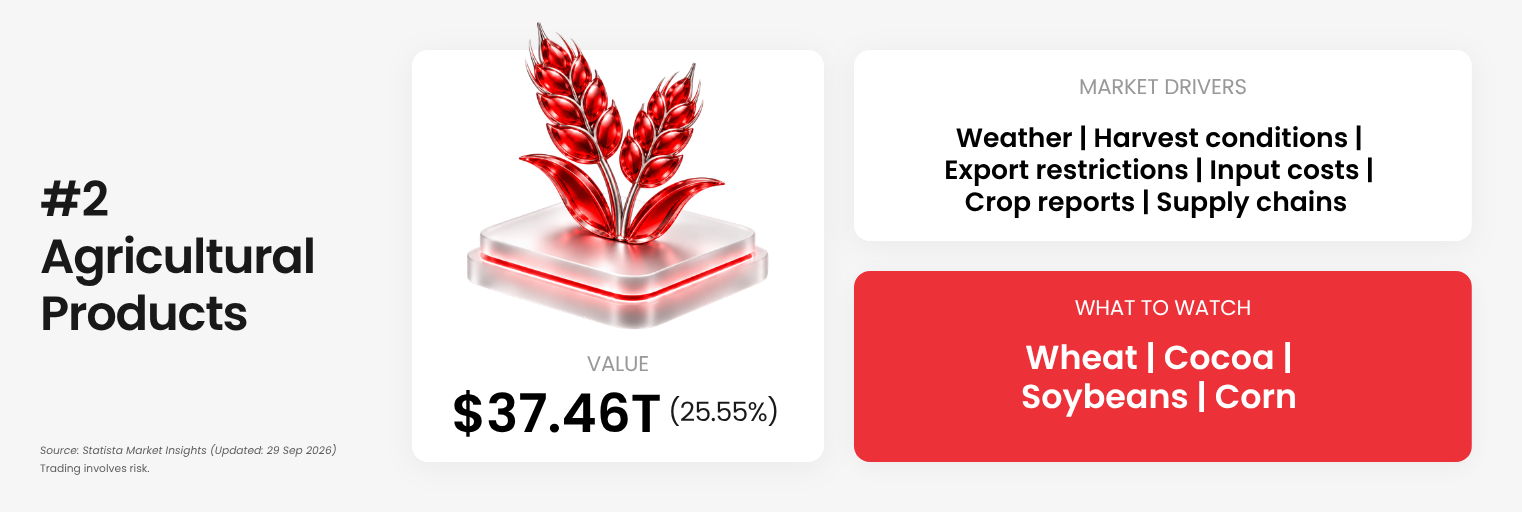
Regardless of the broader economic cycle, global populations need food, creating a massive, stable baseline of demand for Agricultural Products. However, because these soft commodities are bound by seasonal growth cycles, any threat to upcoming yields makes the sector vulnerable to supply shocks.
When these supply disruptions occur, they can produce sustained directional moves across Agricultural Products, particularly as the market is forced to reprice expectations for an entire harvest cycle.
What Moves Agriculture
Weather • Harvest conditions • Export restrictions • Input costs • Crop reports • Supply chains
Markets to Watch
Wheat • Cocoa • Soybeans • Corn
Precious Metals: Where Macro Meets Market Sentiment
- Projected Notional Value: $36.11 Trillion | 24.63%
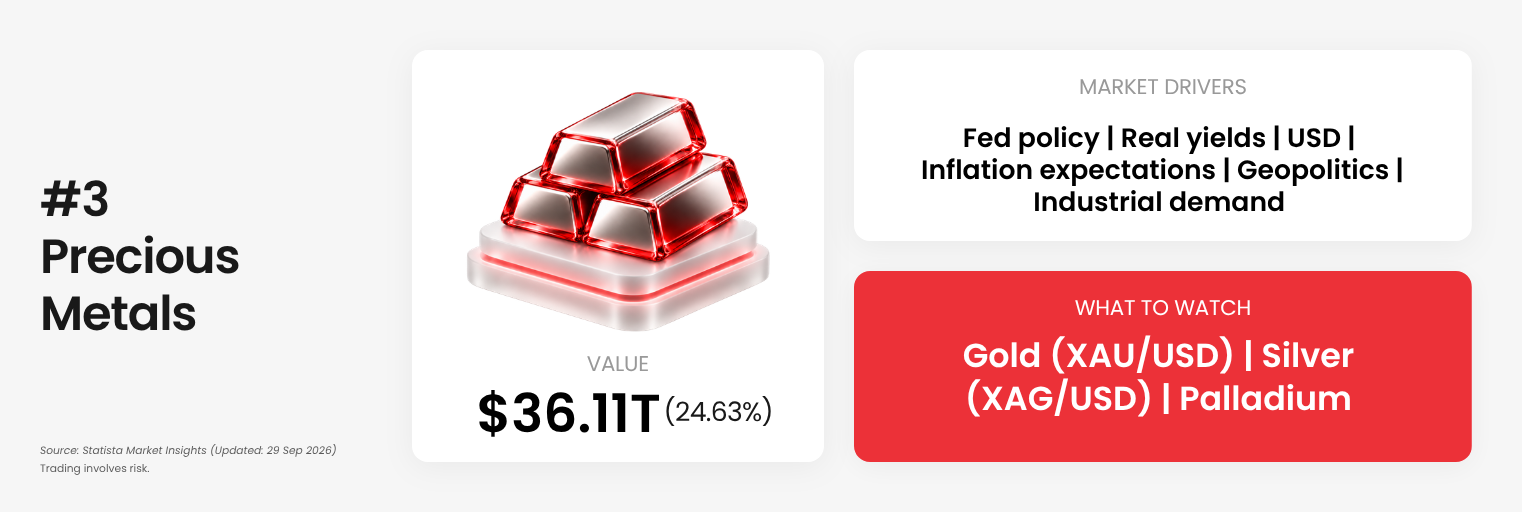
Precious metals sit at an unusual intersection of monetary policy, currencies, investment demand and industrial use. As traders navigate the 2026 commodity market outlook, this sector remains a primary focus.
The gold price is closely watched around changes in real yields, the US dollar, central-bank policy and geopolitical uncertainty, all of which can influence precious metals prices as a whole. Silver adds a significant industrial-demand component, while metals such as palladium have their own supply-and-demand dynamics.
What Moves Precious Metals
Fed policy • Real yields • USD • Inflation expectations • Geopolitics • Industrial demand
Markets to Watch
Gold (XAU/USD) • Silver (XAG/USD) • Palladium.
Industrial Metals: A Read on the Real Economy
- Projected Notional Value: $21.88 Trillion | 14.92%
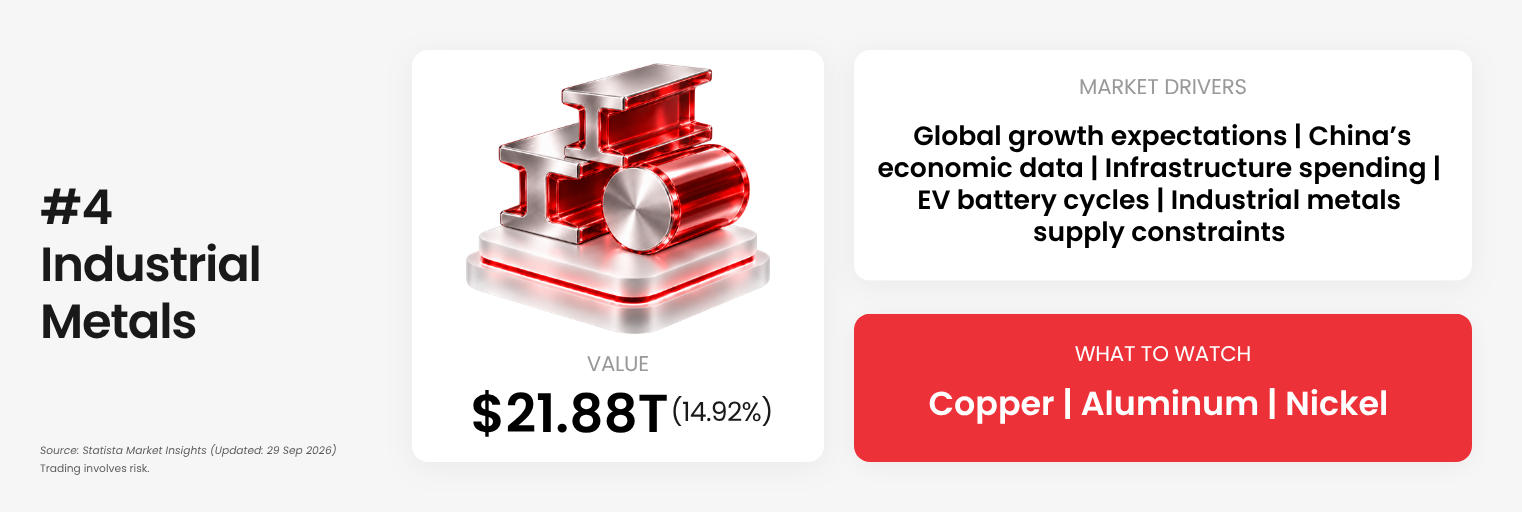
Copper, aluminum, and nickel sit deep inside global construction, manufacturing, infrastructure, and the broader push toward electrification. That makes the sector particularly sensitive to expectations around global growth, especially concerning developments in major industrial economies such as China.
Furthermore, because new industrial metals supply can take years to develop, prices are left particularly sensitive when demand shifts faster than production can respond. This inelasticity, combined with the massive material requirements of the global green transition, makes Industrial Metals highly responsive to macro data.
What Moves Industrial Metals
Global growth expectations • China’s economic data • Infrastructure spending • EV battery cycles • Industrial metals supply constraints
Markets to Watch
Copper • Aluminum • Nickel
What the $146T Commodity Market Actually Tells Traders
The biggest takeaway from the 2026 commodity forecast is not that one commodity sector is “better” than another. It is that each responds to a very different set of forces, shaping a complex 2026 commodity market outlook.
- Energy reacts to supply, geopolitics and global growth.
- Agriculture responds to weather, harvests and trade flows.
- Precious Metals prices sit closer to rates, currencies and risk sentiment.
- Industrial Metals provide another window into manufacturing, infrastructure and the global growth cycle.
The USD 146.64 trillion figure gives us a sense of the market’s scale. The trading decisions still come down to understanding what can move each instrument next.
Take the Commodity View Into Your Trading
Understanding the 2026 commodity market outlook is only half the equation. Once you know which forces are moving energy and metals, the next step is choosing how you want to access those markets.
D Prime gives clients direct access to key commodity instruments, including oil and precious metals, alongside trading conditions designed to support different strategies and minimize friction.
Hold Eligible Oil and Metal Positions Swap-Free for 7 Days
Commodity moves do not always play out within a single session.
With D Prime’s Swap-Free offer, eligible oil and metal positions can receive a 7-day swap-free period. This helps significantly reduce overnight holding costs, allowing you to ride the week’s momentum without the usual drag on your profitability.
(Eligibility and duration are subject to account type and promotion terms. Standard swap charges apply after the swap-free period.)
Are you ready to capture multi-day trends without the overnight friction?
Register a D Prime Swap-Free account today. Take control of your holding costs based on the latest commodity forecast and put 100% of your focus where it belongs: executing your strategy, managing your risk, and maximizing your profit potential on the world’s biggest markets.
Risk Disclosure
Trading in Securities, Futures, contracts for difference (CFDs) and other financial products carries high risks due to the rapid and unpredictable fluctuation in the value and prices of these financial instruments. This unpredictability is due to the adverse and unpredictable market movements, geopolitical events, economic data releases, and other unforeseen circumstances. You may sustain substantial losses including losses exceeding your initial investment within a short period of time.
You are strongly advised to fully understand the nature and inherent risks of trading with the respective financial instrument before engaging in any transactions with us. When you engage in transactions with D Prime, you acknowledge that you are aware of and accept these risks.
Disclaimer
The information contained herein is provided for general informational and educational purposes only and does not constitute investment advice, financial advice, trading advice or any other form of professional advice, a recommendation, or an offer or solicitation to buy or sell any financial instruments or engage in any trading strategy.
Trading in leveraged products such as contracts for difference (CFDs) involves a significant risk of loss and may not be suitable for all investors. Past performance is not indicative of future results. Any references to market trends, asset performance, price levels, or forward-looking statements reflect opinions or general market commentary as at the date of publication and are subject to change without notice.
This article does not take into account any individual investor’s objectives, financial situation, or risk tolerance. Readers should conduct their own independent research and seek professional advice before making any investment or trading decisions. D Prime and its affiliates make no representations or warranties about the accuracy or completeness or reliability of this information and disclaim any and all liability for any direct, indirect, incidental, consequential, or other losses or damages arising out of or in connection with the use of or reliance on any information contained herein. The above information should not be used or considered as the basis for any trading decisions or as an invitation to engage in any transaction. Do not rely on this article to replace your independent judgment.
“D Prime” is a brand name of D Prime Vanuatu Limited, a company incorporated and regulated by the Vanuatu Financial Services Commission (Company Number: 700238). The availability of products and services may vary depending on jurisdiction and applicable regulatory requirements.