


The Fed hiked. The ECB had already moved twice. Two days after the Fed, the Bank of Japan followed.
Yet markets hardly behaved as if a new global tightening shock had arrived. The yen weakened after the BOJ move, Treasury yields eased from their recent peaks, and the Fed’s 25-basis-point increase was absorbed without a sustained selloff.
So what has changed? Possibly something bigger than another rate hike. After years of asking when central banks would ease, markets may be entering a regime where the global cost of capital simply stays higher for longer.
On September 16, the Federal Reserve raised the federal funds target range by 25 basis points to 3.75%–4.00%, its first hike since July 2023. The decision was unanimous at 12–0, compared with July’s 9–3 vote to hold. On September 18, the Bank of Japan raised its policy rate to 1.25%, and earlier in the month the ECB delivered its second 25-basis-point hike since June.
But does this mean a sustained global tightening cycle has begun?
What Changed at the Fed?
The hike itself was widely expected. The more revealing part was the unanimous vote. In July, three FOMC members favored a hike while the majority preferred to wait. By September, all 12 voting members supported tighter policy, which suggests the Fed’s tolerance for persistent inflation has narrowed.
The wording changed too. In July, the Fed partly attributed elevated inflation to supply shocks, including energy. By September, that explanation was gone. The new statement simply said “inflation remains elevated” and that the hike would support a more timely return to the 2% goal.
That omission does not prove the Fed has stopped viewing energy as a supply shock. But it suggests policymakers are focusing less on where inflation comes from and more on stopping it from becoming persistent.
The September Summary of Economic Projections pointed the same way. The median projected federal funds rate for end-2026 rose to 4.1% from 3.8% in June. The unemployment projection was lowered to 4.1%, while projected 2026 headline PCE inflation rose to 3.7% and core PCE to 3.4%.
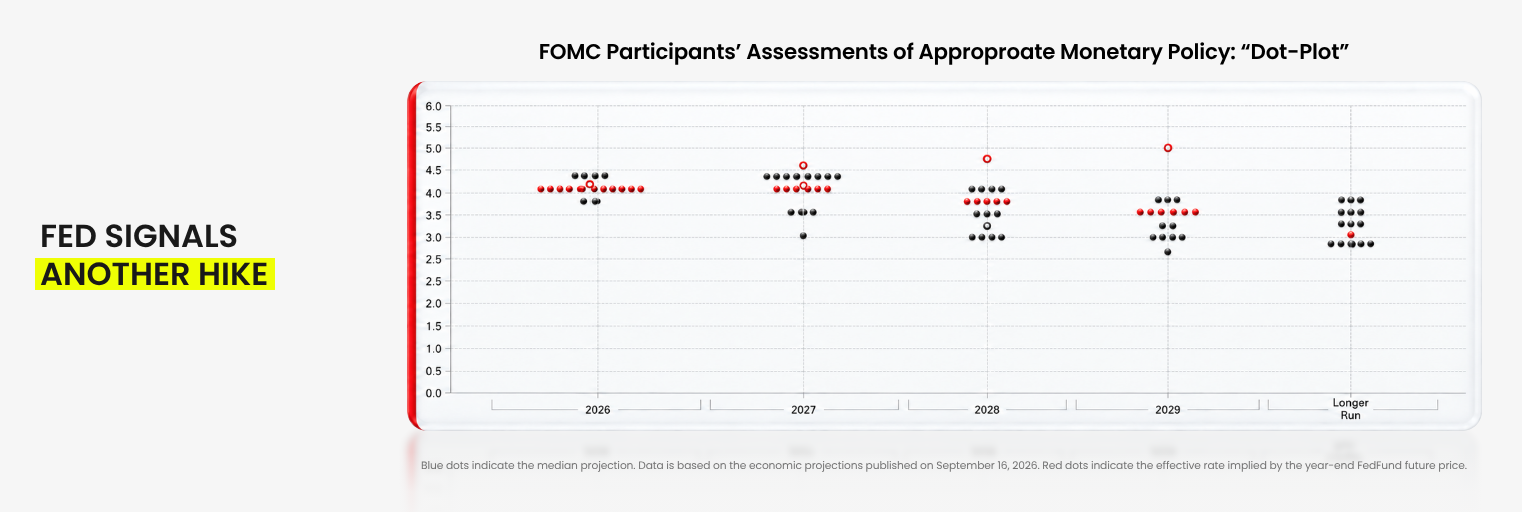
The Fed sees an economy resilient enough to tolerate tighter policy, and inflation uncomfortable enough to justify it.
Why Did the Fed Hike Now?
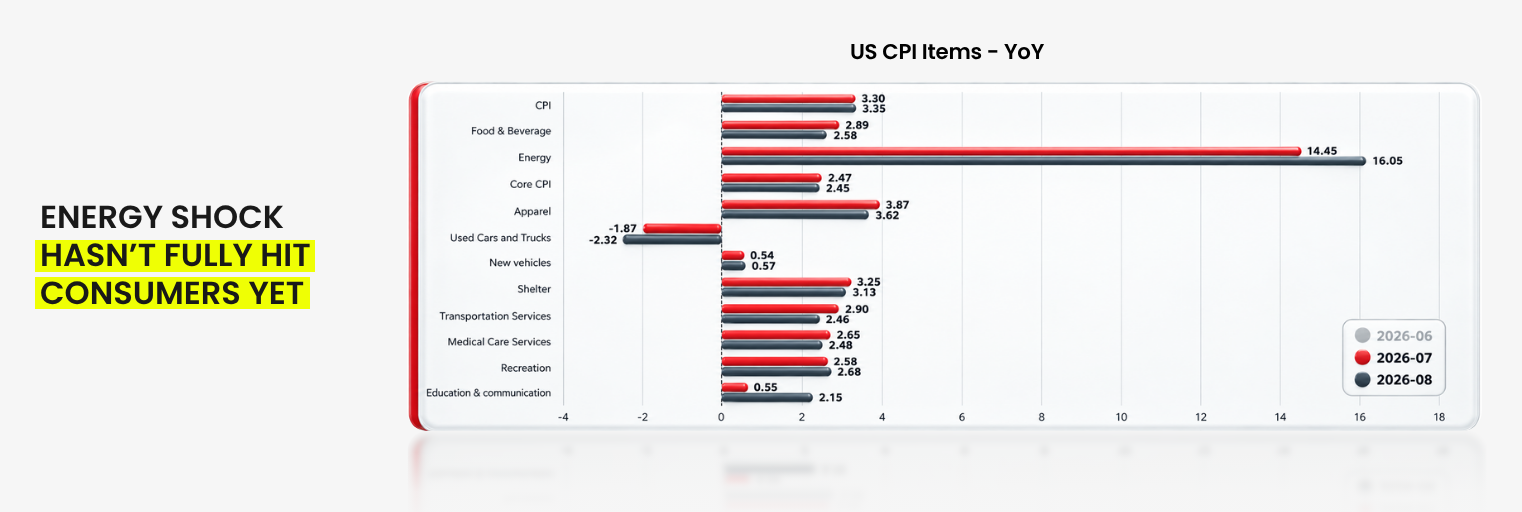
The most immediate reason is inflation. As D Prime discussed in last week’s US CPI Meets Forecasts, So Why Did Fed Still Hike?, August headline CPI matched expectations at 3.4% year over year. Monthly core CPI came in hotter than expected at 0.3%, versus the 0.2% consensus. On the surface, inflation looked controlled. Underneath, monthly core inflation and producer costs were showing more pressure.
Oil added to the risk. Brent crude climbed sharply through September. The longer that shock lasts, the greater the chance that higher energy costs feed into transport, production and services prices.
There is also a reason the Fed may have more room to tighten than the headline rate suggests. The September statement itself said “productivity growth is strong, and capital investment is robust.”
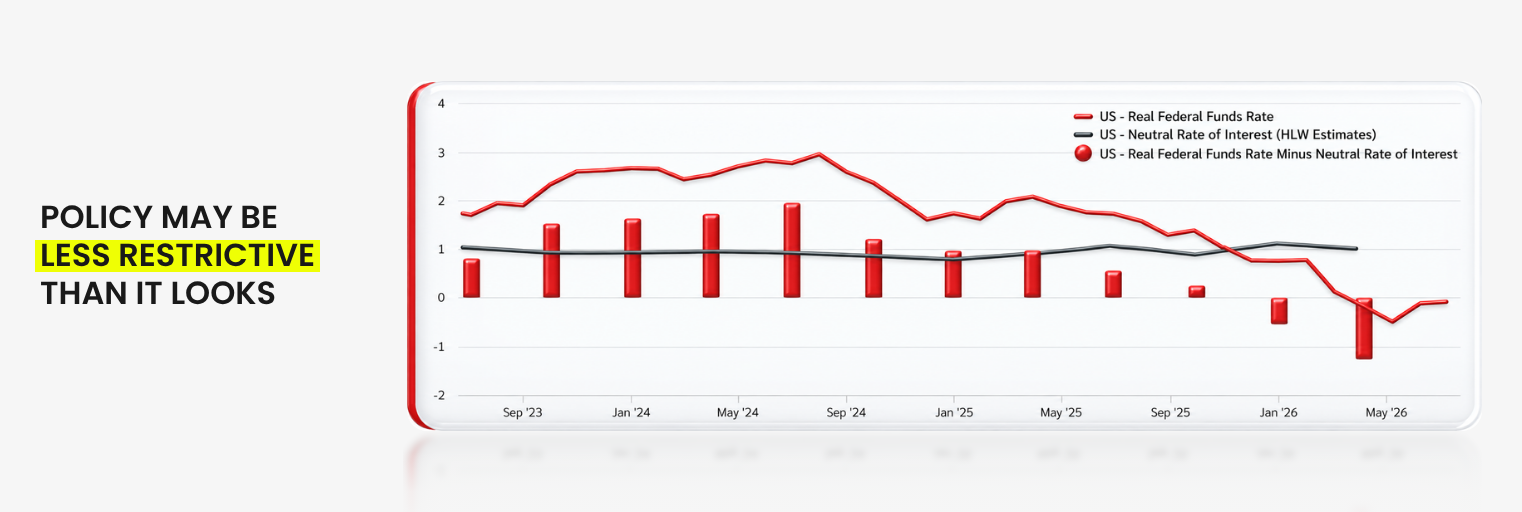
The AI and data-center buildout is a large part of that investment boom, and strong investment demand can push the neutral interest rate, or r-star, higher. The New York Fed defines r-star as the real short-term interest rate consistent with the economy operating at its potential while inflation remains stable. It cannot be observed directly, only estimated through economic models.
That uncertainty matters. If stronger productivity and investment have lifted r-star, monetary policy may be less restrictive than the nominal policy rate alone suggests, and the Fed has less certainty about how tight policy really is.
Has the Global Policy Regime Shifted?
The Fed, ECB and BOJ are all moving tighter, but they are not running the same cycle. They are starting from very different levels: the fed funds range is 3.75%–4.00%, the ECB’s deposit facility rate is 2.50% after its September hike, and the BOJ’s policy rate is 1.25%. They also face different inflation dynamics and are moving at different speeds.
Japan shows how much the market reaction depends on guidance. The yen weakened after the BOJ hike because the move was widely anticipated, two board members opposed it, and the BOJ avoided signalling a more aggressive path. The market got the hike it expected, without a hawkish surprise attached.
Put simply, the era of synchronized easing is over, but that is different from a synchronized hiking cycle.
For the Fed, D Prime’s base case is that September looks more like a pre-emptive inflation-control move than the start of aggressive back-to-back hikes. The economy’s strength is uneven. AI and technology investment remain strong, while real estate, traditional manufacturing, small businesses and other rate-sensitive sectors face greater pressure from elevated borrowing costs. That makes higher for longer more plausible than either rapid cuts or an uninterrupted series of hikes.
What Does the New Rate Regime Mean for Markets?
For markets, long-term borrowing costs may now matter more than the Fed’s next decision.
According to official US Treasury yield data, the 10-year yield reached 5.01% on September 16 before easing to 4.96% on September 21, when the 30-year stood at 5.29%.
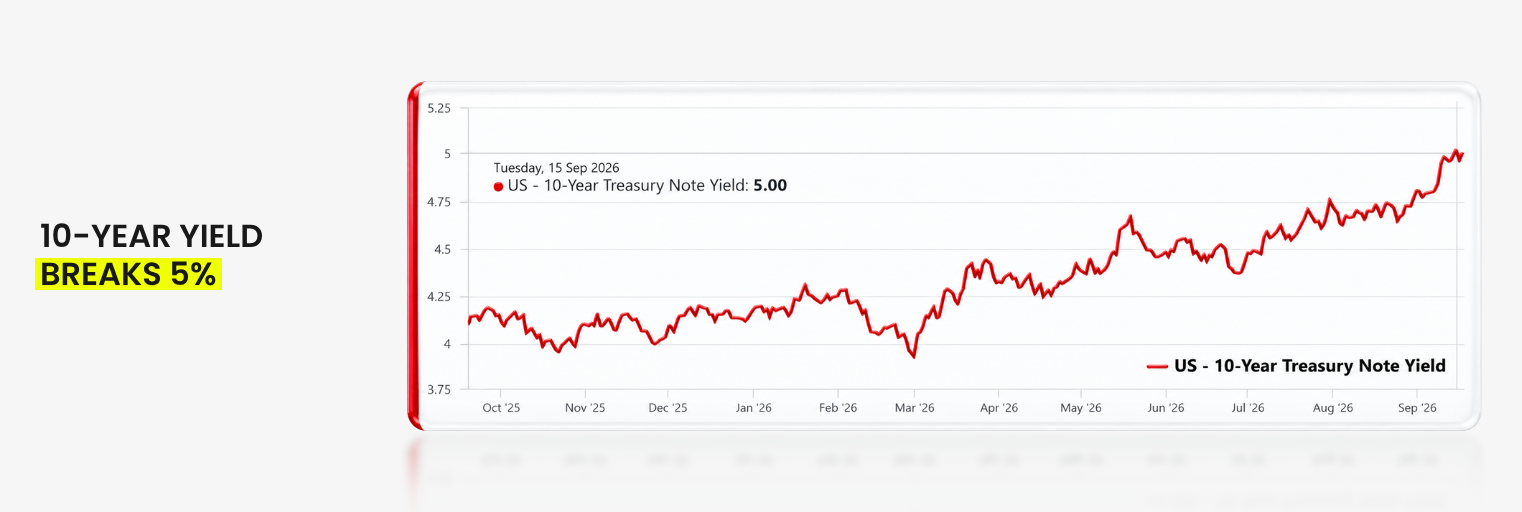
At those levels, the bond market is already tightening financial conditions on the Fed’s behalf, as we explored in our analysis on US Treasury yields.
D Prime Treasury Scenario Framework
These ranges are illustrative D Prime scenarios rather than mechanical forecasts. Treasury yields will also depend on growth, inflation expectations, fiscal issuance and the term premium.
- No further Fed hikes by year-end: 10-year yield potentially moves toward 4.6%–4.9%
- One additional hike by year-end: roughly 4.8%–5.2%
- Two additional hikes by year-end: roughly 5.2%–5.4%
These scenarios illustrate possible paths based on stated assumptions; they are not predictions, targets, or trading recommendations, and actual yields may fall outside these ranges.
What About Stocks?
A rate hike does not automatically end an equity bull market. The Fed began raising rates on June 30, 1999, lifting its target by 25 basis points to 5%. The Nasdaq Composite closed that day at roughly 2,686 and kept climbing through the hikes that followed, reaching around 5,049 in March 2000.
That rally later reversed dramatically, so tightening is hardly harmless. But it shows that rate hikes alone do not set the timing of a market peak. If productivity, investment and earnings stay strong, equities can keep rising as policy tightens. Higher rates make valuations less forgiving, which tends to favor businesses with strong cash flow, durable earnings and less reliance on cheap financing.
What About FX?
Higher US yields can support the dollar, particularly if markets keep pricing a higher-for-longer Fed. But Japan complicates the dollar-yen carry trade. As Japanese rates rise, the cost advantage of borrowing in yen shrinks. That can reduce the appeal of leveraged yen-funded positions and slow Japanese capital flows into overseas assets.
With the US-Japan rate gap still wide, yen volatility may matter more than a simple directional call on USD/JPY. We looked at that risk in more detail in Will a Stronger Yen End the Market Rally?
What About Gold?
Higher real yields raise the opportunity cost of holding gold and can cap its upside. But recent flows suggest rising yields are also doing something else.
World Gold Council data show global gold ETFs attracted USD 18 billion in August, the second-largest monthly inflow in dollar terms on record, lifting holdings by 121 tonnes to a record 4,189 tonnes. The WGC said the inflows likely reflected, among other factors, rising long-term US yields and the US Treasury’s August bond market intervention, which heightened concerns about fiscal sustainability and dollar debasement.
Gold futures settled at around USD 4,345.80 on September 21 after three consecutive sessions of gains. The key question for gold is why yields are rising. A move driven by Fed tightening and higher real rates is a headwind. A move driven by fiscal and debasement fears may keep supporting demand.
What Should Traders Watch Next?
Central banks are tightening. What matters now is how far they go and how markets absorb the higher cost of capital.
US PCE (September 30): The BEA’s August Personal Income and Outlays release includes the Fed’s preferred inflation measures.
September NFP (October 2): The BLS Employment Situation report will show whether the labor market is still resilient after August’s stronger payrolls.
September CPI (October 14): The next CPI release will show whether August’s core acceleration was temporary or persistent.
FOMC (October 27–28): The Fed’s next meeting is the first test of whether September was an isolated adjustment or the start of a broader hiking phase.
Beyond the calendar, watch the 10-year Treasury yield around 5%, oil, yen volatility, corporate earnings, and whether gold keeps holding up against elevated yields.
The September hike mattered, but the bigger shift is that markets can no longer assume easier money is just around the corner. That does not guarantee an aggressive synchronized hiking cycle. It does point to a different regime: higher rates, higher capital costs and less room for assets that depend on cheap liquidity.
For traders, the task now is identifying which assets can still perform when money stays expensive.
By D Prime Analysis Team
Macro and market strategy research by D Prime’s in-house analysis team.
Disclaimer
The information contained herein is provided for general informational and educational purposes only and does not constitute investment advice, financial advice, trading advice or any other form of professional advice, a recommendation, or an offer or solicitation to buy or sell any financial instruments or engage in any trading strategy.
Trading in leveraged products such as contracts for difference (CFDs) involves a significant risk of loss and may not be suitable for all investors. Past performance is not indicative of future results. Any references to market trends, asset performance, price levels, or forward-looking statements reflect opinions or general market commentary as at the date of publication and are subject to change without notice.
This article does not take into account any individual investor’s objectives, financial situation, or risk tolerance. Readers should conduct their own independent research and seek professional advice before making any investment or trading decisions. D Prime and its affiliates make no representations or warranties about the accuracy or completeness or reliability of this information and disclaim any and all liability for any direct, indirect, incidental, consequential, or other losses or damages arising out of or in connection with the use of or reliance on any information contained herein. The above information should not be used or considered as the basis for any trading decisions or as an invitation to engage in any transaction. Do not rely on this article to replace your independent judgment.
“D Prime” is a brand name of D Prime Vanuatu Limited, a company incorporated and regulated by the Vanuatu Financial Services Commission (Company Number: 700238). The availability of products and services may vary depending on jurisdiction and applicable regulatory requirements.